

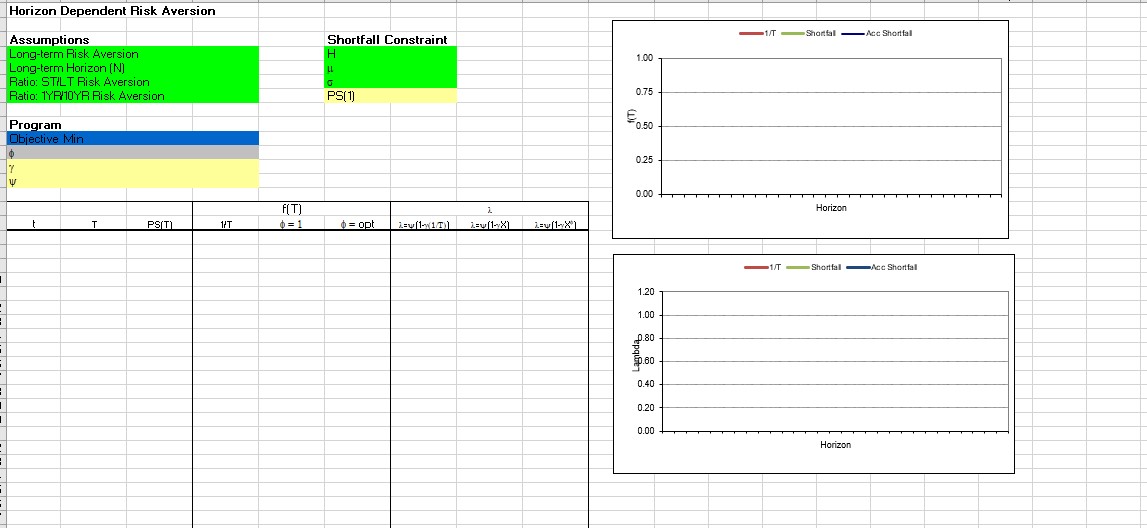
Question: Use the worksheet in the file Chapter 05 Excel Outboxes.xls to compute the (30-year/1-year) and (30-year/10-year) ratios of optimal stock allocations when the market is
Use the worksheet in the file Chapter 05 Excel Outboxes.xls to compute the (30-year/1-year) and (30-year/10-year) ratios of optimal stock allocations when the market is on the trend . a. Using these ratios to approximate the corresponding risk aversion ratios in the horizon-dependent risk aversion model, set the long-run risk aversion to 1.1 and fit the HD RRA model. b. Using the spreadsheet find the optimal portfolios for 1-, 5-, 10-, 15-, 20-, 25-, and 30-year horizons. (Note: The links in this spreadsheet should have pulled in the horizon dependent risk aversions from part (a). Otherwise copy them into the appropriate cells.) c. Using Excel's chart wizard to create
an x-y graph, plot the HD RRA model's total equity allocation at these horizons versus the corresponding equity allocations from the DP mean reversion model. How well did the HD RRA model capture the horizon implications of the mean reversion?
Step by Step Solution
There are 3 Steps involved in it

Get step-by-step solutions from verified subject matter experts