

Question: Use this for reference: Problem 2 Overview: A quick trigonometry review 1. Sines, cosines, and the circle Supposes we had a circle of radius r
Use this for reference:
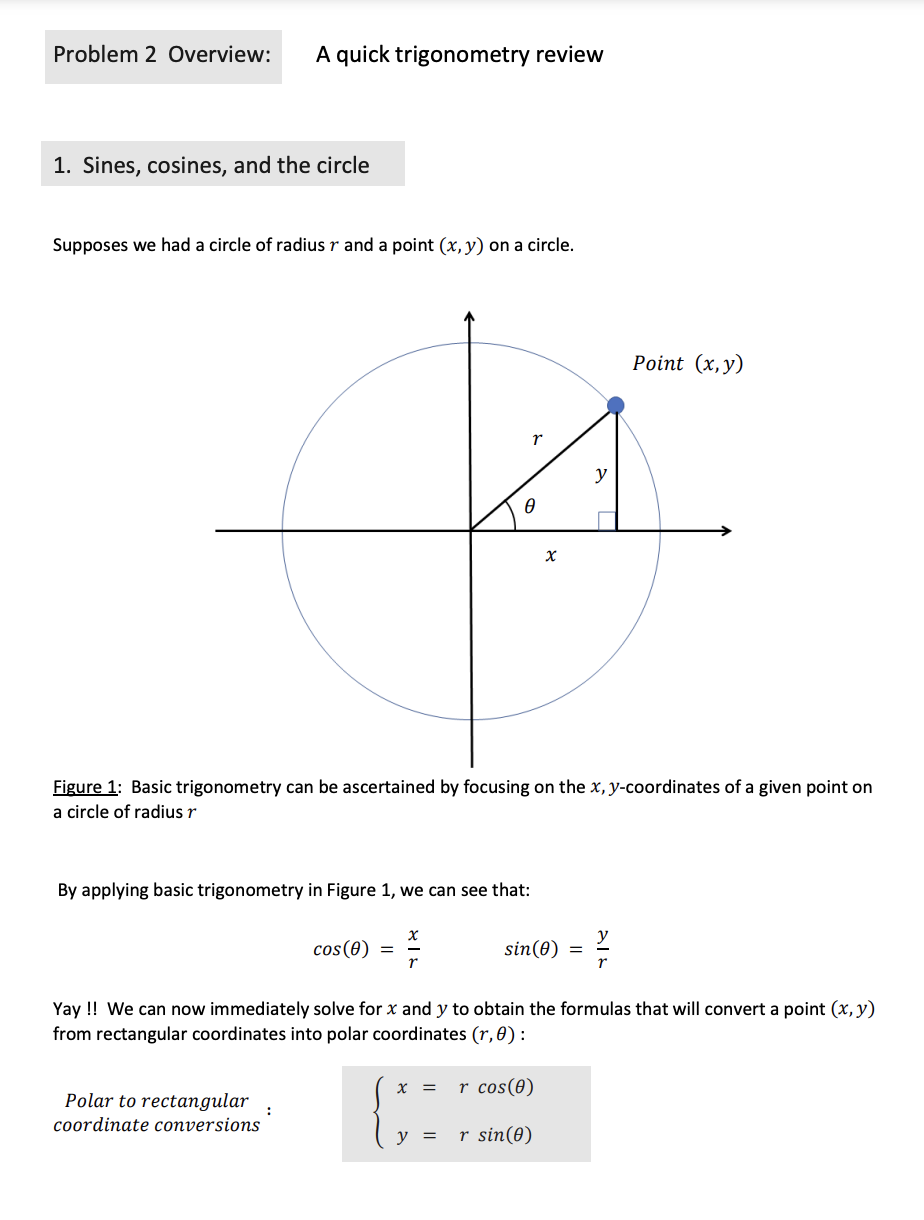
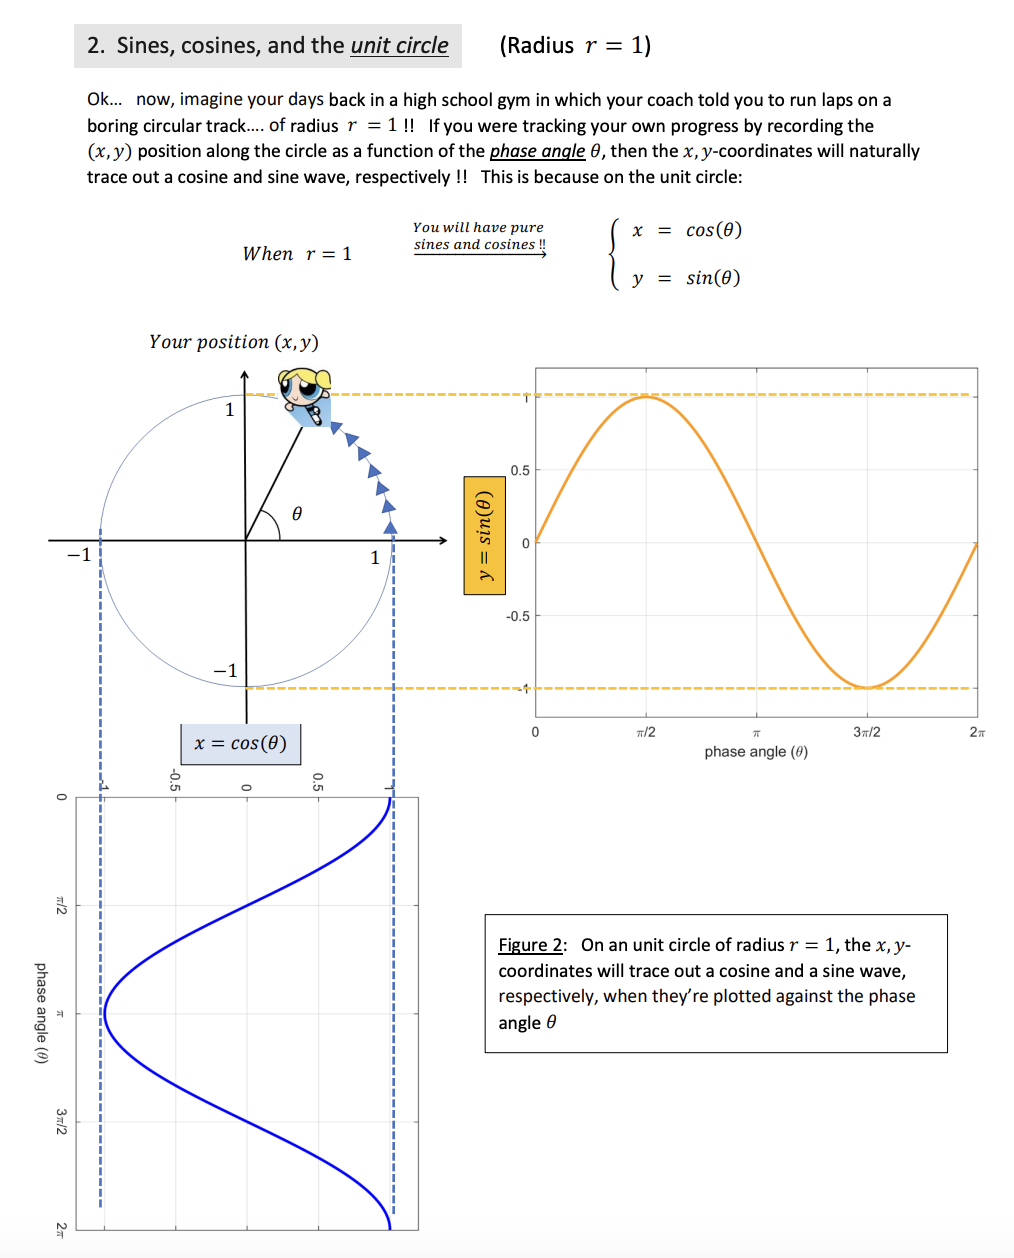
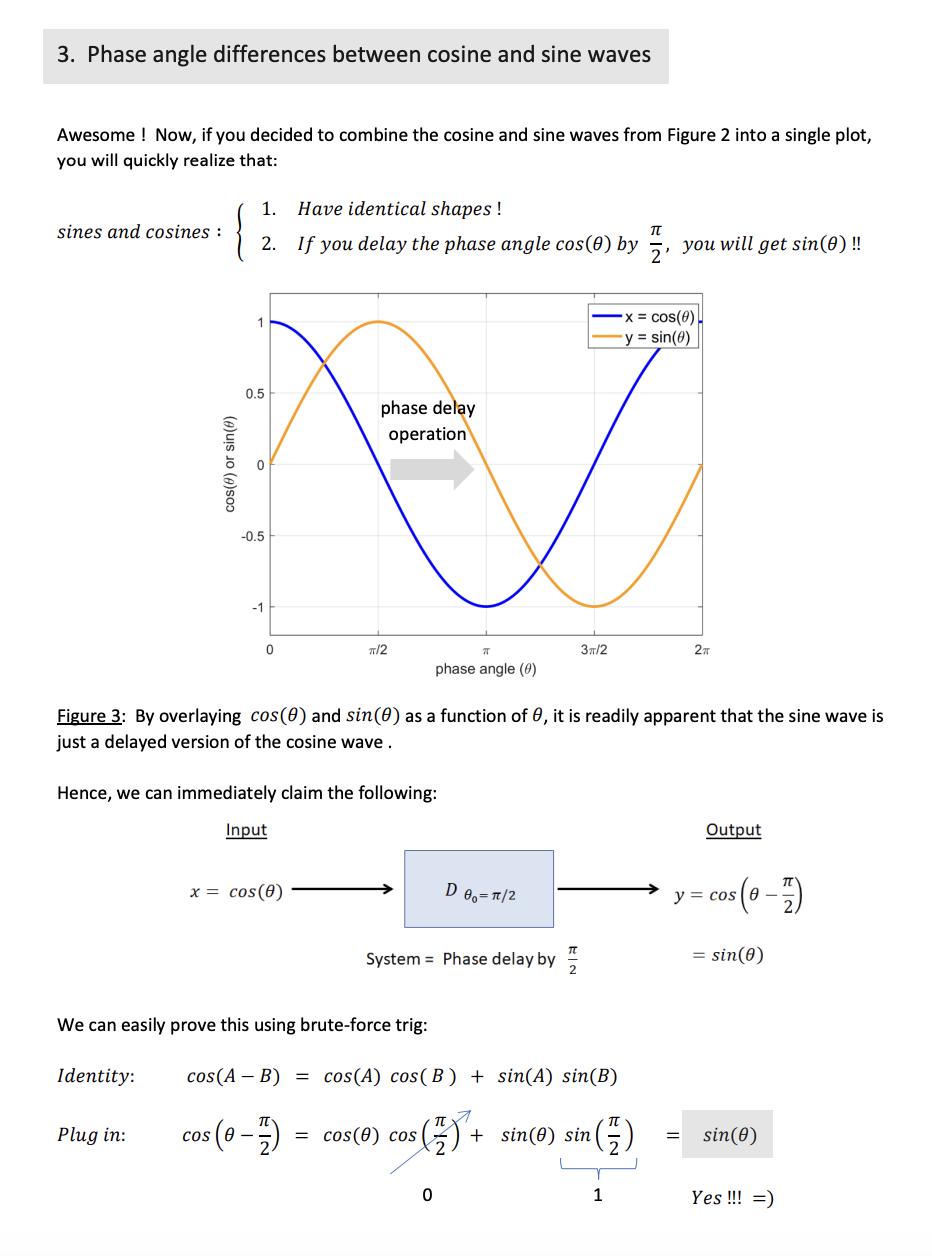
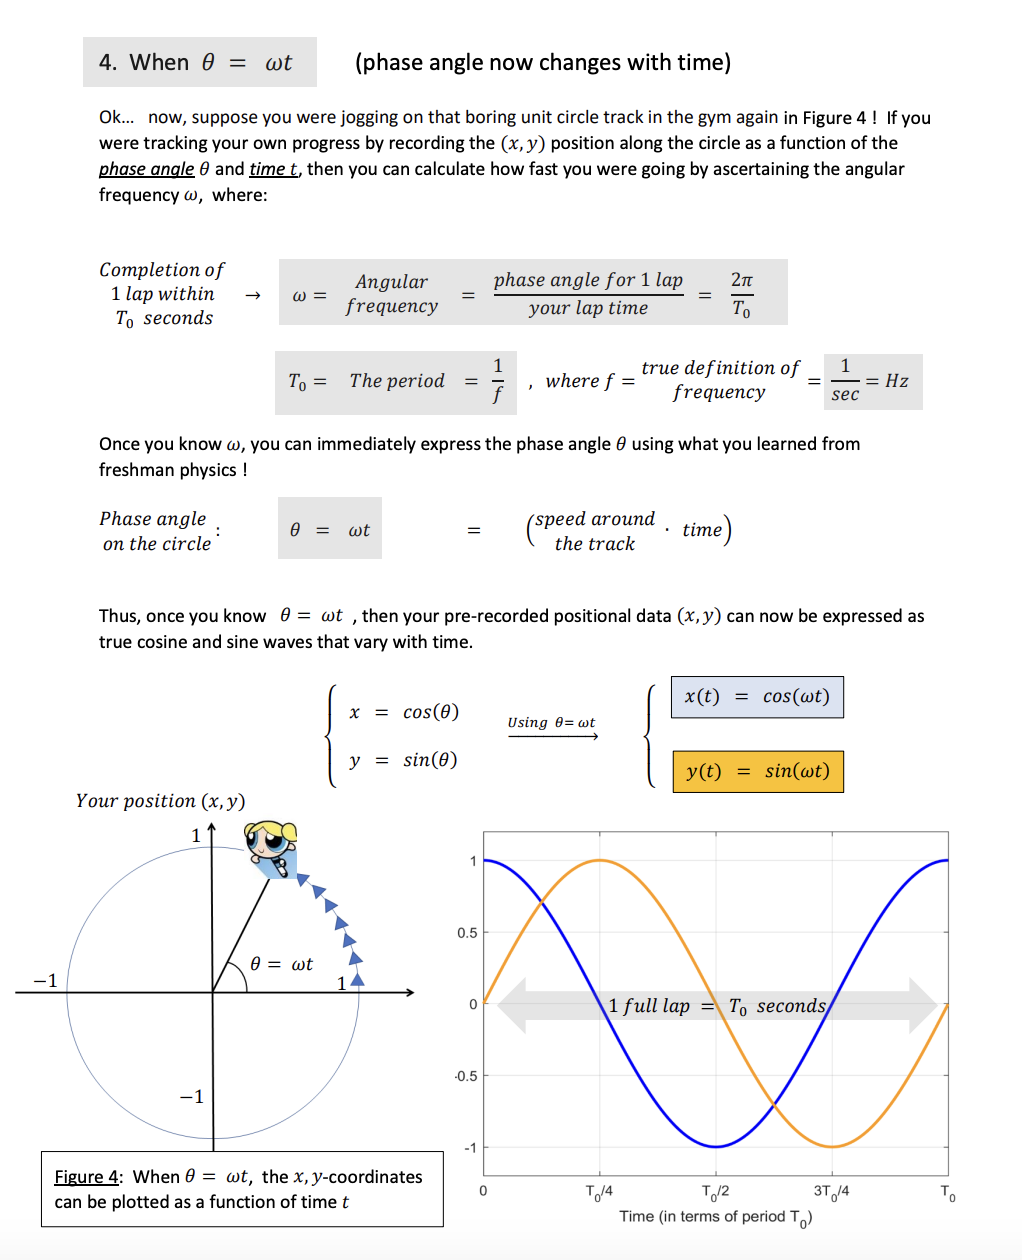
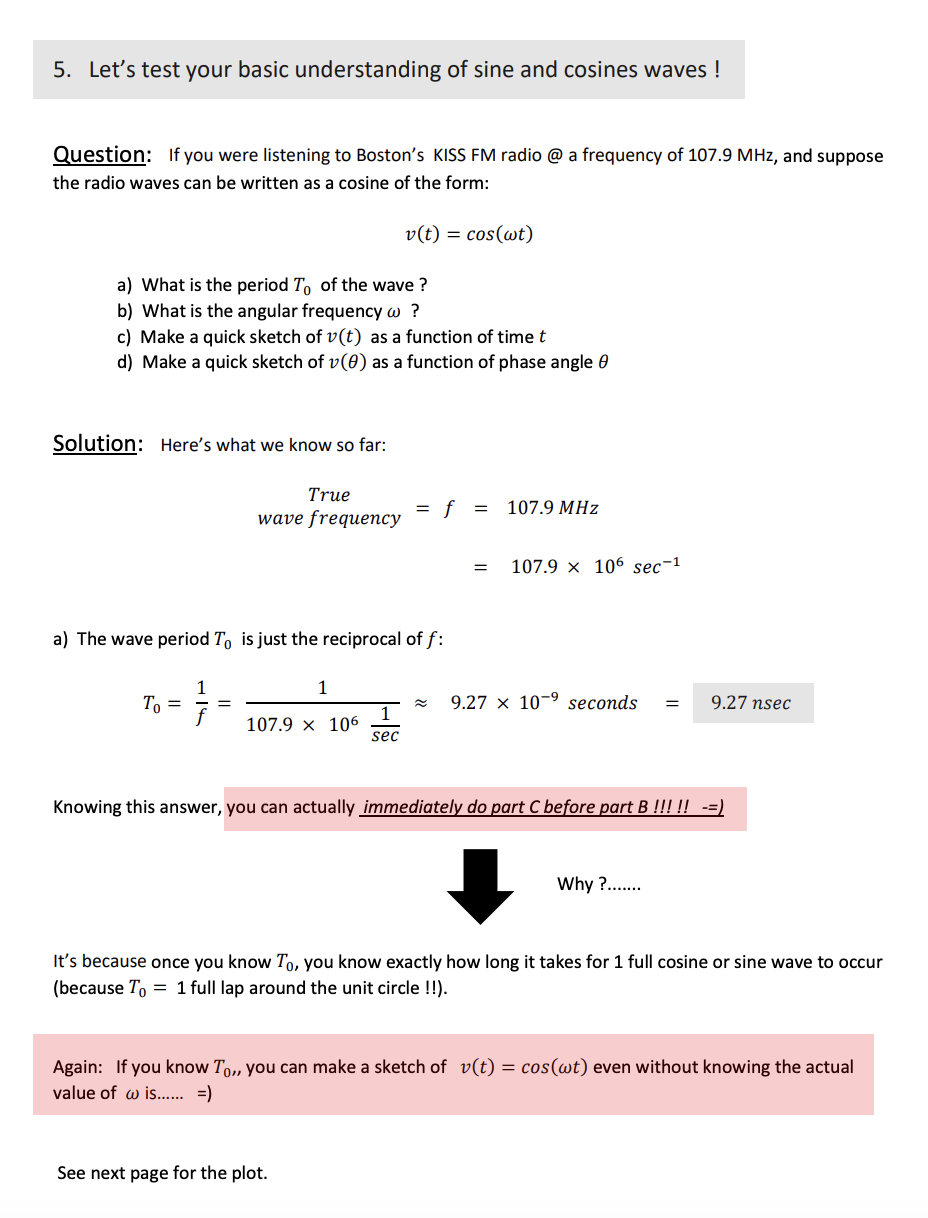
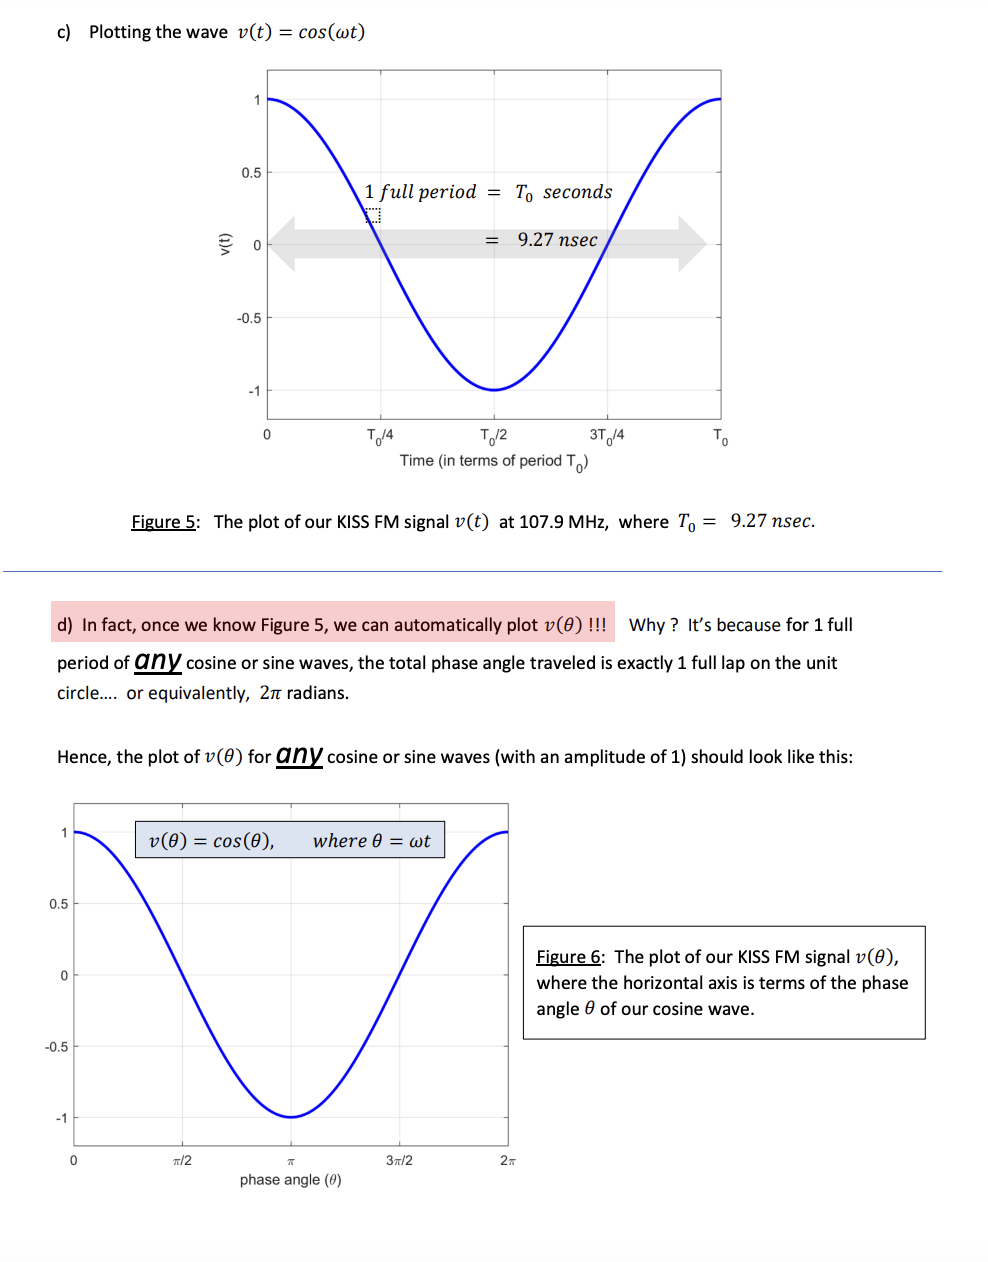
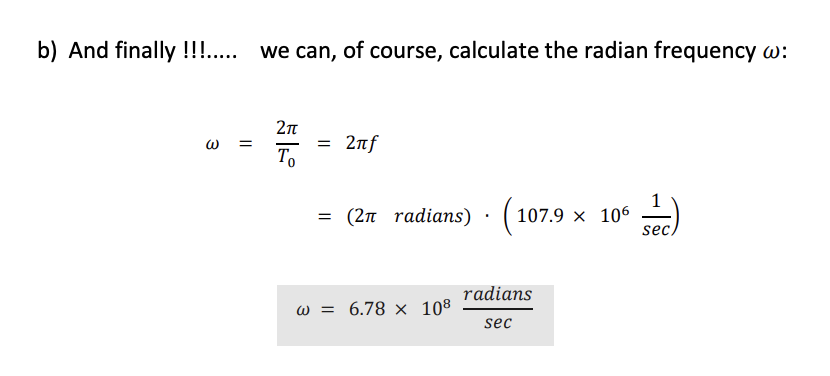
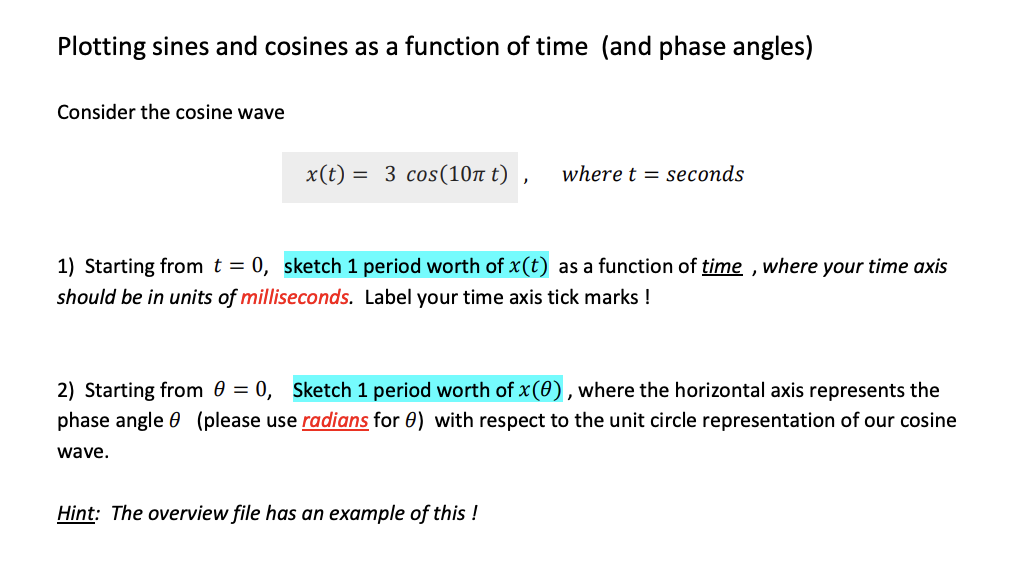
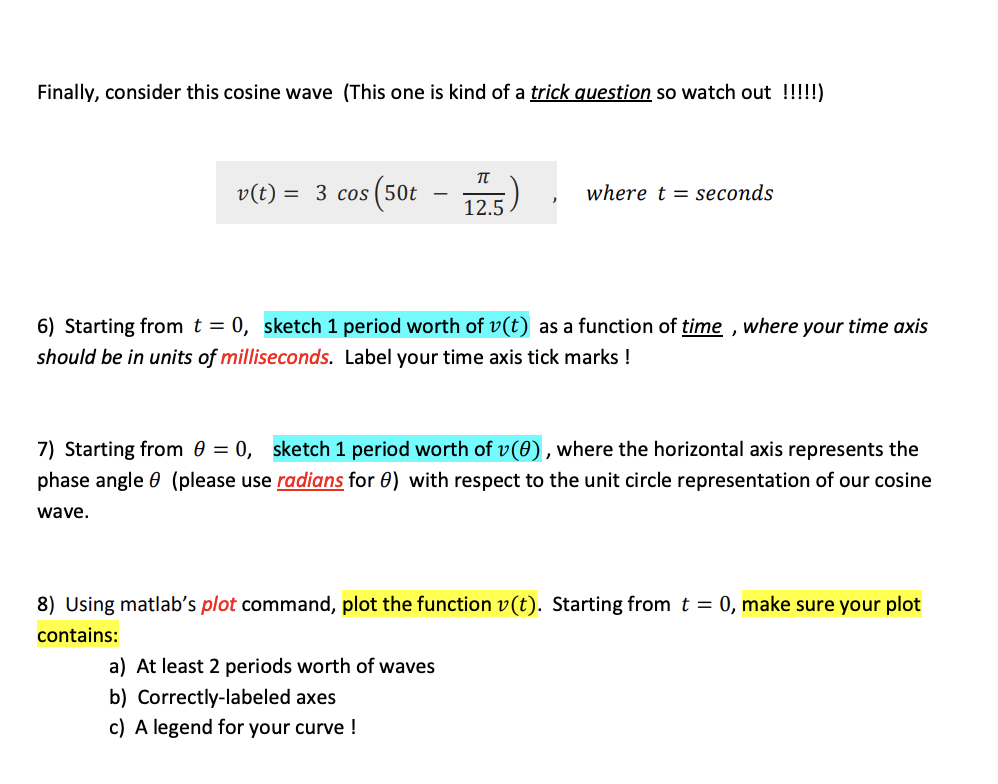
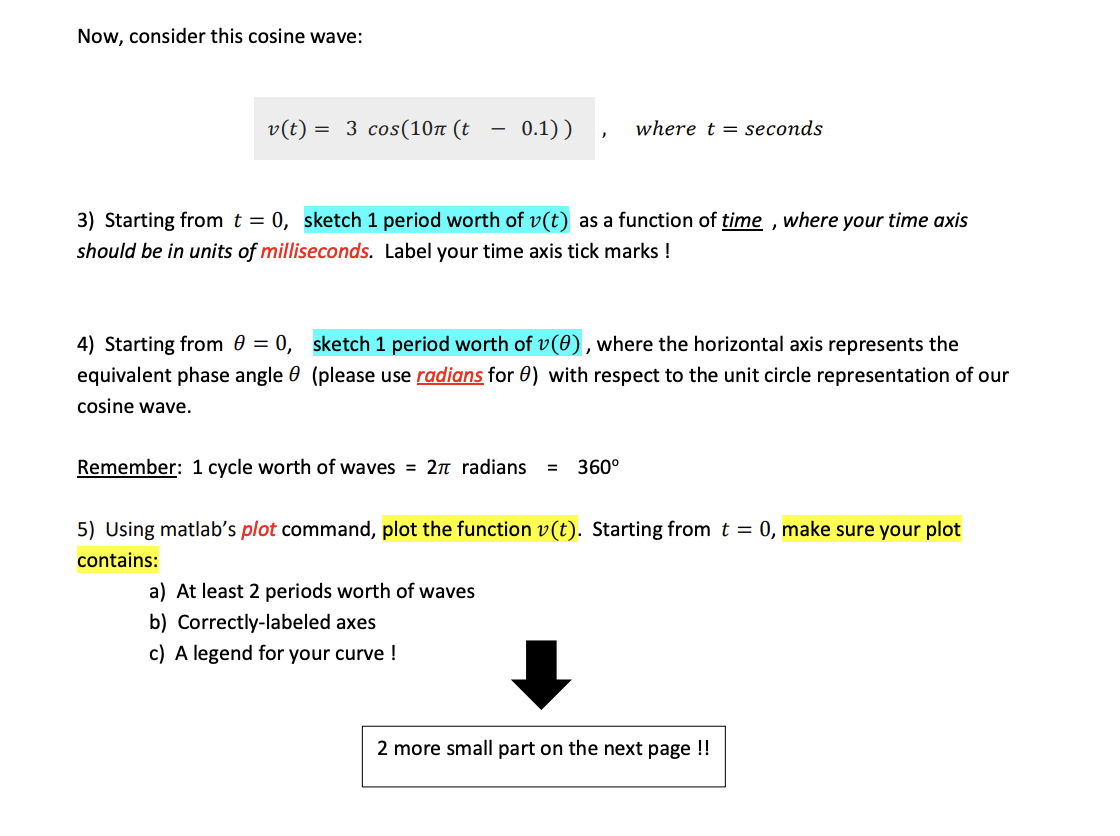
Problem 2 Overview: A quick trigonometry review 1. Sines, cosines, and the circle Supposes we had a circle of radius r and a point (x, y) on a circle. Point (x, y) Figure 1: Basic trigonometry can be ascertained by focusing on the x, y-coordinates of a given point on a circle of radius r By applying basic trigonometry in Figure 1, we can see that: cos(0) = sin(0) = Yay !! We can now immediately solve for x and y to obtain the formulas that will convert a point (x, y) from rectangular coordinates into polar coordinates (r, 0) : x = r cos(0) Polar to rectangular coordinate conversions y = r sin(0)2. Sines, cosines, and the unit circle (Radius r = 1) Ok... now, imagine your days back in a high school gym in which your coach told you to run laps on a boring circular track... of radius r = 1 !! If you were tracking your own progress by recording the (x, y) position along the circle as a function of the phase angle 0, then the x, y-coordinates will naturally trace out a cosine and sine wave, respectively !! This is because on the unit circle: You will have pure x = cos(0) When r = 1 sines and cosines ! y = Your position (x, y) 0.5 y = sin(0) 0 1 -0.5 0 71/2 37/2 2 TT x = cos(0) phase angle (0) c'O SO O Figure 2: On an unit circle of radius r = 1, the x, y- coordinates will trace out a cosine and a sine wave, respectively, when they're plotted against the phase phase angle (0) angle 0 37/23. Phase angle differences between cosine and sine waves Awesome ! Now, if you decided to combine the cosine and sine waves from Figure 2 into a single plot, you will quickly realize that: 1. Have identical shapes! SHEsanAESiaEss 2. If youdelay the phase angle cos(8) by g, you will get sin(8) !! x = cos(#) y = sin(#) o w phase delay operation cos(#) or sin(#) = o 0 w2 e 3n/2 27 phase angle (#) Figure 3: By overlaying cos(8) and sin(#) as a function of 8, it is readily apparent that the sine wave is just a delayed version of the cosine wave . Hence, we can immediately claim the following: Input Output i > T x=cos() > D g,n/2 y = cos (6' - E) System = Phase delay by % = sin(0) We can easily prove this using brute-force trig: Identity: cos(AB) = cos(4) cos(B) + sin(A) sin(B) i my T 7 ; (T _ ; Plug in: cos (HE) = cos(0) mf,(;f) + sm()lsm(z)l = sin(8) /, 'T. 0 1 Yes!ll =) 4. When 0 = wt (phase angle now changes with time) Ok... now, suppose you were jogging on that boring unit circle track in the gym again in Figure 4 ! If you were tracking your own progress by recording the (x, y) position along the circle as a function of the phase angle 0 and time t, then you can calculate how fast you were going by ascertaining the angular frequency w, where: Completion of 1 lap within Angular phase angle for 1 lap 2 TC W = frequency = To seconds your lap time To 1 To = The period = where f = true definition of _ frequency - = Hz sec Once you know w, you can immediately express the phase angle 0 using what you learned from freshman physics ! Phase angle 0 = wt speed around . time) on the circle the track Thus, once you know 0 = wt , then your pre-recorded positional data (x, y) can now be expressed as true cosine and sine waves that vary with time x(t) = cos(wt) x = cos(0) Using 0= wt = sin(0) y(t) = sin(wt) Your position (x, y) 0.5 0 = wt -1 14 0 1 full lap = To seconds 0.5 -1 -1 Figure 4: When 0 = wt, the x, y-coordinates can be plotted as a function of time t To/4 To/2 3T 14 Time (in terms of period To)5. Let's test your basic understanding of sine and cosines waves ! Question: If you were listening to Boston's KISS FM radio @ a frequency of 107.9 MHz, and suppose the radio waves can be written as a cosine of the form: v(t) = cos(wt) a) What is the period T, of the wave ? b) What is the angular frequency w ? c) Make a quick sketch of v(t) as a function of time t d) Make a quick sketch of v(8) as a function of phase angle 8 Solution: Here's what we know so far: True wavre f?"equency = f 107.9 MHz 1079 x 106 sec1 a) The wave period T, is just the reciprocal of f: 1 1 Tp= == =~ 0927 x 107? seconds = 9.27 nsec 1 6 1079 x 10 0 Knowing this answer, you can actually immediately do part C before part B 1111l -= Why ?....... It's because once you know T, you know exactly how long it takes for 1 full cosine or sine wave to occur (because Ty = 1 full lap around the unit circle 11). Again: If you know Tj,, you can make a sketch of v(t) = cos(wt) even without knowing the actual value of w is...... =) See next page for the plot. c) Plotting the wave v(t) = cos(wt) 0.5 1 full period = T, seconds = 9.27 nsec 05 0 T /4 T2 3T, /4 T Time (in terms of period Tod Figure 5: The plot of our KISS FM signal v(t) at 107.9 MHz, where T, = 9.27 nsec. d) In fact, once we know Figure 5, we can automatically plot v(8) !!! Why ? It's because for 1 full period of @MY cosine or sine waves, the total phase angle traveled is exactly 1 full lap on the unit circle.... or equivalently, 2 radians. Hence, the plot of v(8) for N Y cosine or sine waves (with an amplitude of 1) should look like this: ! v(08) = cos(8), where 8 = wt 05 - Figure 6: The plot of our KISS FM signal v(8), S where the horizontal axis is terms of the phase angle @ of our cosine wave. 05 - 1} 0 /2 : 3nf2 2 phase angle (#) b) And finally !ll..... we can, of course, calculate the radian frequency w: _ 2 _ 5 w = = 2nf 1 = (2 radians) - (107.9 x 10⁶ ) sec radians w = 6.78 x 10⁸ Sec Plotting sines and cosines as a function of time (and phase angles) Consider the cosine wave x(t) = 3 cos(10mt) , wheret = seconds 1) Starting from t = 0, sketch 1 period worth of x(t) as a function of time , where your time axis should be in units of milliseconds. Label your time axis tick marks ! 2) Starting from 8 = 0, Sketch 1 period worth of x(8) , where the horizontal axis represents the phase angle @ (please use radians for 8) with respect to the unit circle representation of our cosine wave. Hint: The overview file has an example of this ! m gt =93 cos(SOt E) , Wwhere t = seconds 6) Starting from t = 0, sketch 1 period worth of v(t) as a function of time , where your time axis should be in units of milliseconds. Label your time axis tick marks ! 7) Starting from 6 = 0, sketch 1 period worth of v(8) , where the horizontal axis represents the phase angle @ (please use radians for 8) with respect to the unit circle representation of our cosine wave. 8) Using matlab's plot command, plot the function v(t). Starting from t = 0, make sure your plot contains: a) At least 2 periods worth of waves b) Correctly-labeled axes c) Alegend for your curve ! Now, consider this cosine wave: v(t) = 3 cos(10n(t 0.1)) , where t=seconds 3) Starting from t = 0, sketch 1 period worth of v(t) as a function of time , where your time axis should be in units of milliseconds. Label your time axis tick marks ! 4) Starting from 6 =0, sketch 1 period worth of v(8) , where the horizontal axis represents the equivalent phase angle 8 (please use radians for 8) with respect to the unit circle representation of our cosine wave. Remember: 1 cycle worth of waves = 2w radians = 360 5) Using matlab's plot command, plot the function v(t). Starting from t = 0, make sure your plot contains: a) Atleast 2 periods worth of waves b) Correctly-labeled axes c) A legend for your curve ! ' 2 more small part on the next page
Step by Step Solution
There are 3 Steps involved in it

Get step-by-step solutions from verified subject matter experts