

Question: Use this graph Do not use excel 1. draw a graph (use proper scale, label all lines) showing EOQ model using the following data: Sales
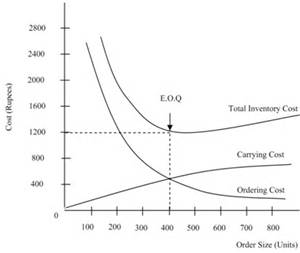
Use this graph
Do not use excel
1. draw a graph (use proper scale, label all lines) showing EOQ model using the following data:
Sales 75,000 units
Ordering costs $8 per order
Carrying costs $1.20 per unit
2800 2400 2000 1600 EO.O Total Inventory Cost 1200 800 400 Carrying Cost Ondering Cost 00 200 300 400 500 70000 Order Size (Units)
Step by Step Solution
There are 3 Steps involved in it
1 Expert Approved Answer
Step: 1 Unlock

Question Has Been Solved by an Expert!
Get step-by-step solutions from verified subject matter experts
Step: 2 Unlock
Step: 3 Unlock