

Question: Use this graph to answer the question. 76 72 2010 68 64 bu Sales 56 (thousands of dollars) 52 2009 48 44 40 1 2
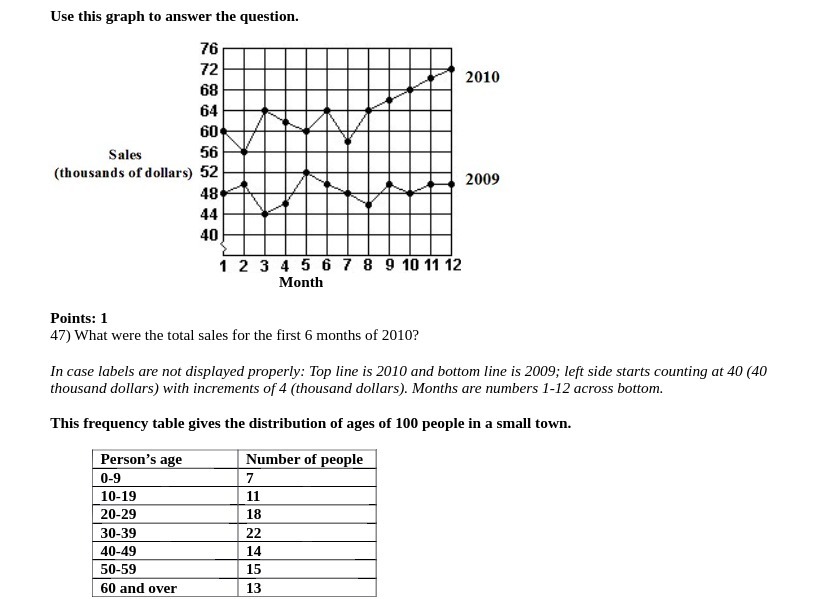
Use this graph to answer the question. 76 72 2010 68 64 bu Sales 56 (thousands of dollars) 52 2009 48 44 40 1 2 3 4 5 6 7 8 9 10 11 12 Month Points: 1 47) What were the total sales for the first 6 months of 2010? In case labels are not displayed properly: Top line is 2010 and bottom line is 2009; left side starts counting at 40 (40 thousand dollars) with increments of 4 (thousand dollars). Months are numbers 1-12 across bottom. This frequency table gives the distribution of ages of 100 people in a small town. Person's age Number of people 0-9 7 10-19 11 20-29 18 30-39 22 40-49 14 50-59 15 60 and over 13
Step by Step Solution
There are 3 Steps involved in it
1 Expert Approved Answer
Step: 1 Unlock

Question Has Been Solved by an Expert!
Get step-by-step solutions from verified subject matter experts
Step: 2 Unlock
Step: 3 Unlock