

Question: Use this information as needed to answer the next five questions. (Hints: Market data is at the bottom. This info is not needed for all
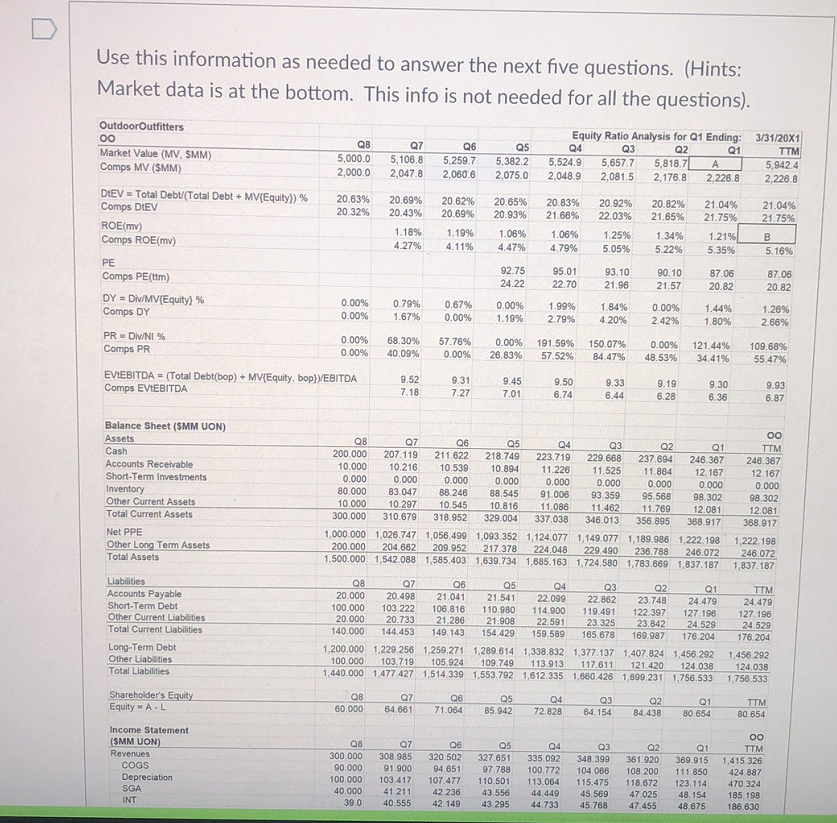
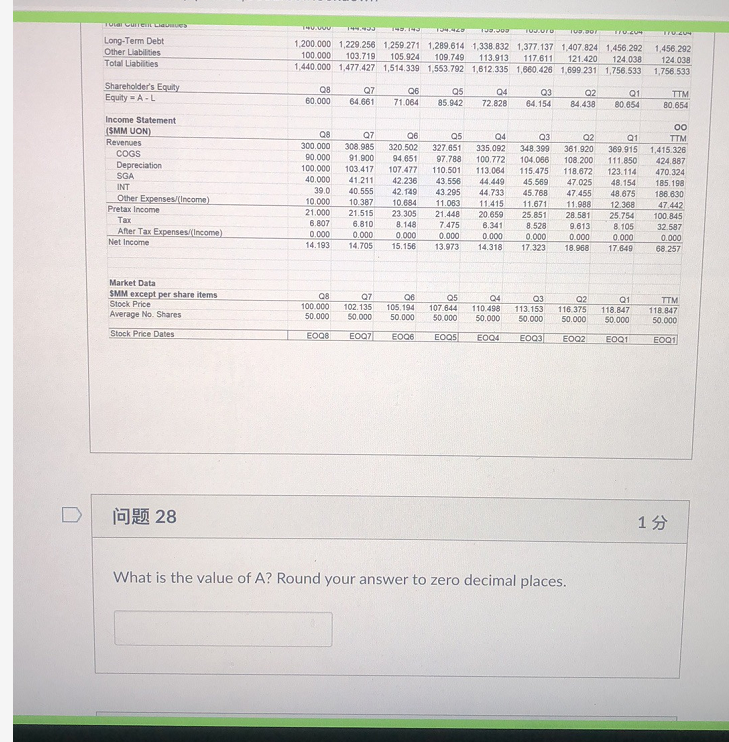
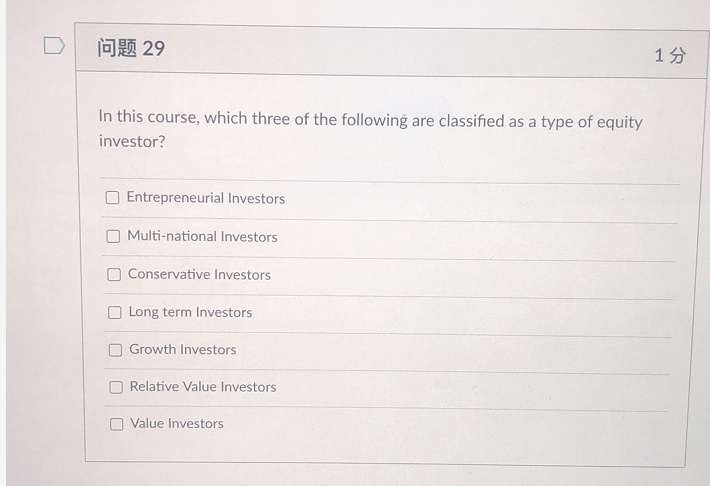
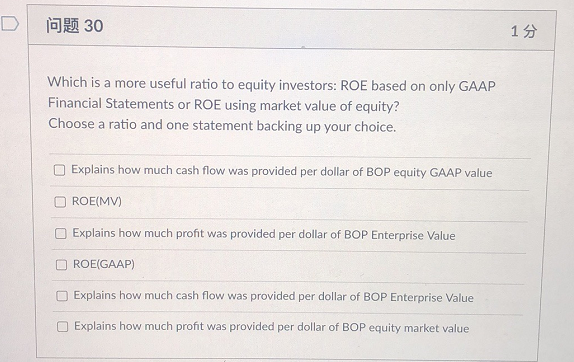
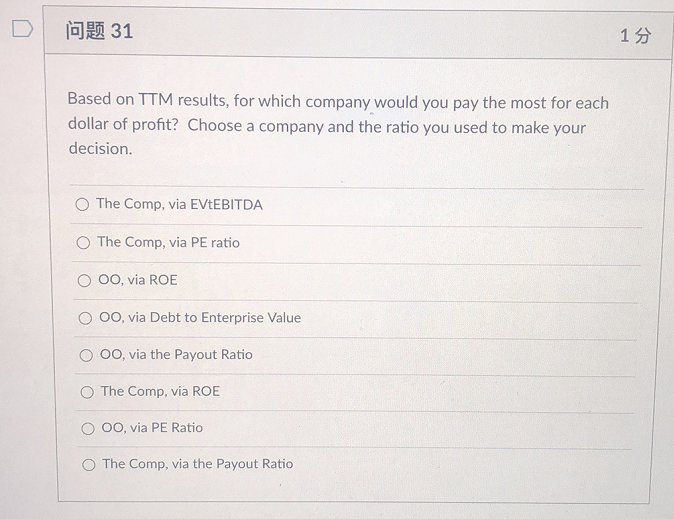
Use this information as needed to answer the next five questions. (Hints: Market data is at the bottom. This info is not needed for all the questions). OutdoorOutfitters oo Market Value (MV, SMM) Comps MV (SMM) Q8 5,000.0 2,000.0 Q7 5,106.8 2,047.8 Q6 5,259.7 2,060.6 Q5 5,382.2 2,075.0 Equity Ratio Analysis for Q1 Ending: 3/31/20X1 Q4 Q3 Q2 Q1 TTM 5,524.9 5,657.7 5,818.7 5,942.4 2,048.9 2,081,5 2,176.8 2,226.8 2,226.8 DIEV = Total Debu (Total Debt + MV(Equity]) % Comps DEV ROE(mv) Comps ROE(mv) 20.63% 20.32% 20.69% 20.43% 20.62% 20.69% 20.65% 20.93% 20.83% 21.66% 20.92% 22.03% 20.82% 21.65% 21.04% 21.75% 21.04% 21.75% 1.18% 4.27% 1.19% 4.11% 1.06% 4.47% 1.06% 4.79% 1.25% 5.05% 1.34% 5.22% 1.21% 5.35% B 5.16% PE Comps PE(ttm) DY - Div/MV(Equity} % Comps DY 92.75 24.22 95.01 22.70 93.10 21.96 90.10 21.57 87.06 20.82 87.06 20.82 0.00% 0.00% 0.79% 1.67% 0.67% 0.00% 0.00% 1.19% 1.99% 2.79% 1.84% 4.20% 0.00% 2.42% 1.44% 1.80% 1.26% 2.66% PR Div/NI % Comps PR 0.00% 0.00% 68.30% 40.09% 57.76% 0.00% 0.00% 26.83% 191.59% 57.529 150.07% 84.47% 0.00% 48.53% 121.44% 34.41% 109.68% 55.47% EVEEBITDA = (Total Debt(bop) + MV(Equity, bop)YEBITDA Comps EVLEBITDA 9.52 7.18 9.31 7.27 9.45 7.01 9.50 6.74 9.33 6.44 9.19 6.28 9.30 6.36 9.93 6.87 Balance Sheet($MM UON) Assets Cash Accounts Receivable Short-Term Investments Inventory Other Current Assets Total Current Assets QB Q7 Q6 Q5 Q4 Q3 Q2 Q1 200.000 207.119 211.622 218.749 223.719 229.668 237.694 246.367 10.000 10.216 10.539 10.894 11.226 11.525 11.864 12.167 0.000 0.000 0.000 0.000 0.000 0.000 0.000 0.000 80.000 83.047 86.246 88.545 91.006 93.359 95.568 98.302 10.000 10.297 10,545 10.816 11.086 11.462 11.769 12.081 300.000 310.679 318.952 329.004 337 038 346.013 356.895 368.917 1.000.000 1,026.747 1,056.499 1,093.352 1,124.077 1,149.077 1,189.986 1.222.198 200.000 204.662 209.952 217.378 224.048 229.490 236.788 246.072 1.500.000 1.542.088 1,585.403 1,639.734 1.685.163 1,724.580 1.783.669 1,837.187 oo TTM 246.367 12.167 0.000 98.302 12.081 368.917 Net PPE Other Long Term Assets Total Assets 1,222.198 246 072 1,837.187 Liabilities Accounts Payable Short-Term Debt Other Current Liabilities Total Current Liabilities Q8 Q7 Q6 Q5 Q4 Q3 Q2 Q1 20.000 20.498 21.041 21.541 22.099 22.862 23.748 24.479 100.000 103.222 106.816 110.980 114.900 119.491 122.397 127.196 20.000 20.733 21.286 21.908 22.591 23.325 23.842 24.529 140.000 144.453 149.143 154.429 159.589 165.678 169.987 176.204 1.200.000 1.229.256 1.259.271 1,289.614 1,338.832 1,377.137 1,407 824 1,456.292 100.000 103.719 105.924 109.749 113.913 117.611 121.420 124.038 1,440.000 1.477.427 1,514 339 1.553.792 1,612.335 1,680.426 1,699.231 1.756.533 TTM 24.479 127.196 24.529 176.204 Long-Term Debt Other Liabilities Total Liabilities 1,456.292 124.038 1.756.533 Shareholder's Equity Equity - A-L QB 60.000 Q7 64.661 Q6 71.064 Q5 85.942 Q4 72.828 Q3 64.154 Q2 84.438 Q1 80.654 TTM 80.654 Income Statement (SMM UON) Revenues COGS Depreciation SGA INT Q8 300.000 90.000 100.000 40.000 39.0 Q7 308.985 91.900 103.417 41.211 40.555 Q6 320.502 94.651 107.477 42.236 42 149 Q5 327.651 97.788 110.501 43.556 43.295 Q4 335.092 100.772 113.064 44.449 44.733 Q3 348.399 104.066 115.475 45.569 45.768 Q2 361.920 108.200 118.672 47025 47.455 Q1 369.915 111 850 123.114 48.154 48.675 oo TTM 1,415.326 424.887 470.324 185.198 186.630 TULI CUTILLS 13.03 04 Long-Term Debt Other Liabilities Total Liabilities . 13 TOUT TUDI 1.200.000 1.229.256 1,259 271 1,289.614 1,338 832 1,377.137 1,407 824 1,456.292 100.000 103.719 105 924 109.749 113.913 117.611 121.420 124.038 1,440.000 1,477.427 1,514.339 1,553.792 1,612 335 1,660,426 1,899 231 1756.533 1,456.292 124.038 1,756 533 Shareholder's Equity Equity = A -L Q8 60.000 Q7 64.661 Q6 71.064 Qs 85.942 04 72.828 Q3 64.154 Q2 84.438 Q1 80.654 TTM 80.654 Income Statement SMM UON) Revenues COGS Depreciation SGA INT Other Expenses (Income) Pretax Income Tax After Tax Expenses (Income) Net Income Q8 300.000 90.000 100.000 40.000 39.0 10.000 21.000 6.807 0 000 14.193 07 308.985 91.900 103.417 41 211 40.555 10.387 21.515 6.810 0.000 14.705 Q6 320.502 94651 107.477 42.236 42.149 10.684 23.305 8.148 0.000 15.156 Q5 327.651 97.788 110.501 43.556 43.295 11.083 21.448 7.475 0.000 13.973 Q4 335.092 100.772 113.064 44.449 44.733 11415 20.659 6.341 0.000 14.318 Q3 348.399 104.066 115.475 45.569 45.768 11.671 25.851 8.528 0.000 17 323 02 361.920 108.200 118,672 47.025 47.455 11.988 28.581 9.613 0.000 18.968 Q1 369.915 111.850 123.114 48.154 48.675 12 368 25.754 8.105 0.000 17.649 oo TTM 1,415.326 424.887 470.324 185.198 186.630 47.442 100.845 32.587 0.000 68.257 Market Data $MM except per share items Stock Price Average No Shares Q8 100.000 50.000 Q7 102.135 50.000 06 105.194 50.000 Q5 107.644 50.000 04 110.498 50.000 Q3 113.153 50.000 Q2 116 375 50.000 Q1 118.847 50.000 TTM 118.847 50.000 Stock Price Dates EOQ8 EOQ7 E0Q6 EOOS E004 E003 EDOZ EOQ1 E001 28 1 What is the value of A? Round your answer to zero decimal places. 29 15 In this course, which three of the following are classified as a type of equity investor? Entrepreneurial Investors O Multi-national Investors Conservative Investors Long term Investors Growth Investors Relative Value Investors Value Investors 30 15 Which is a more useful ratio to equity investors: ROE based on only GAAP Financial Statements or ROE using market value of equity? Choose a ratio and one statement backing up your choice. Explains how much cash flow was provided per dollar of BOP equity GAAP value ROE(MV) Explains how much profit was provided per dollar of BOP Enterprise Value ROE(GAAP) Explains how much cash flow was provided per dollar of BOP Enterprise Value Explains how much profit was provided per dollar of BOP equity market value 31 19 Based on TTM results, for which company would you pay the most for each dollar of profit? Choose a company and the ratio you used to make your decision. The Comp, via EVDEBITDA The Comp, via PE ratio OO, via ROE 00, via Debt to Enterprise Value O 00, via the Payout Ratio The Comp, via ROE 00, via PE Ratio The Comp, via the Payout Ratio 32 1 What is the value of B
Step by Step Solution
There are 3 Steps involved in it

Get step-by-step solutions from verified subject matter experts