

Question: Use tidyverse function throughout the assignment where possible. 1. (2 pts) Write (tidyverse) code to read in the sdtran2_house.cav data set. Read your data into
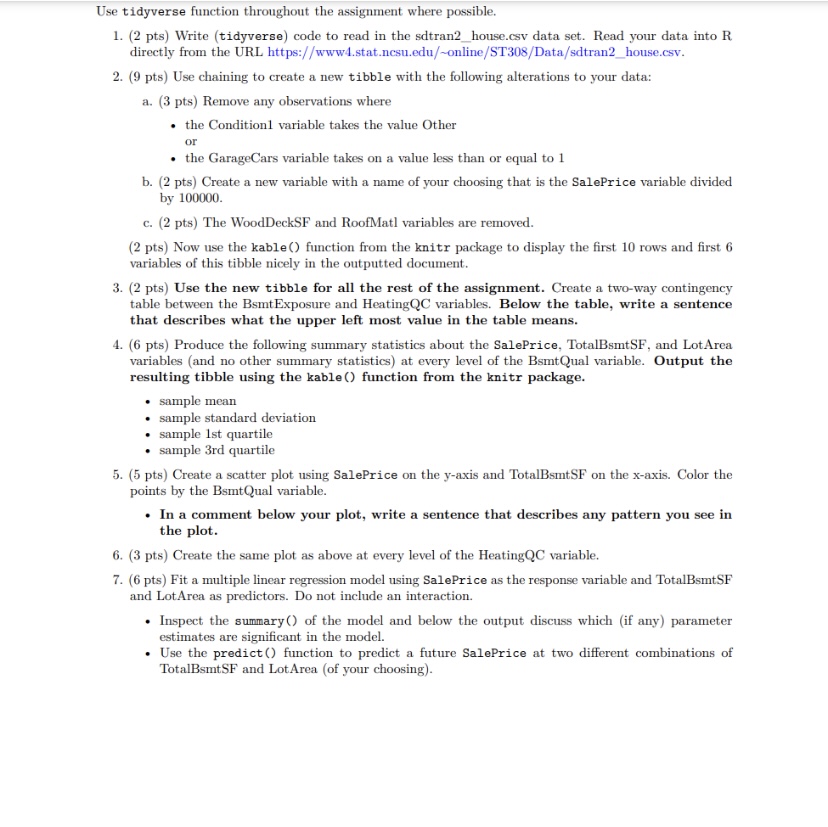
Use tidyverse function throughout the assignment where possible. 1. (2 pts) Write (tidyverse) code to read in the sdtran2_house.cav data set. Read your data into R directly from the URL https://www4.stat.ncsu.edu/-online/ST308/Data/sdtran2_house.csv. 2. (9 pts) Use chaining to create a new tibble with the following alterations to your data: a. (3 pts) Remove any observations where . the Condition1 variable takes the value Other or . the GarageCars variable takes on a value less than or equal to 1 b. (2 pts) Create a new variable with a name of your choosing that is the SalePrice variable divided by 100000. c. (2 pts) The WoodDeckSF and RoofMath variables are removed. (2 pts) Now use the kable () function from the knitr package to display the first 10 rows and first 6 variables of this tibble nicely in the outputted document. 3. (2 pts) Use the new tibble for all the rest of the assignment. Create a two-way contingency table between the Bamt Exposure and HeatingQC variables. Below the table, write a sentence that describes what the upper left most value in the table means. 4. (6 pts) Produce the following summary statistics about the SalePrice, TotalBamtSF, and LotArea variables (and no other summary statistics) at every level of the BaitQual variable. Output the resulting tibble using the kable () function from the knitr package. . sample mean . sample standard deviation sample 1st quartile sample 3rd quartile 5. (5 pts) Create a scatter plot using SalePrice on the y-axis and TotalBamtSF on the x-axis. Color the points by the BsitQual variable. In a comment below your plot, write a sentence that describes any pattern you see in the plot. 6. (3 pts) Create the same plot as above at every level of the HeatingQC variable. 7. (6 pts) Fit a multiple linear regression model using SalePrice as the response variable and TotalBamtSF and LotArea as predictors. Do not include an interaction. . Inspect the summary () of the model and below the output discuss which (if any) parameter estimates are significant in the model. . Use the predict () function to predict a future SalePrice at two different combinations of TotalBamtSF and Lot Area (of your choosing)
Step by Step Solution
There are 3 Steps involved in it

Get step-by-step solutions from verified subject matter experts