

Question: Use tiles to create the 2 plots in this problem. Let the vector scores = [ 5 0 , 6 8 , 8 3 ,
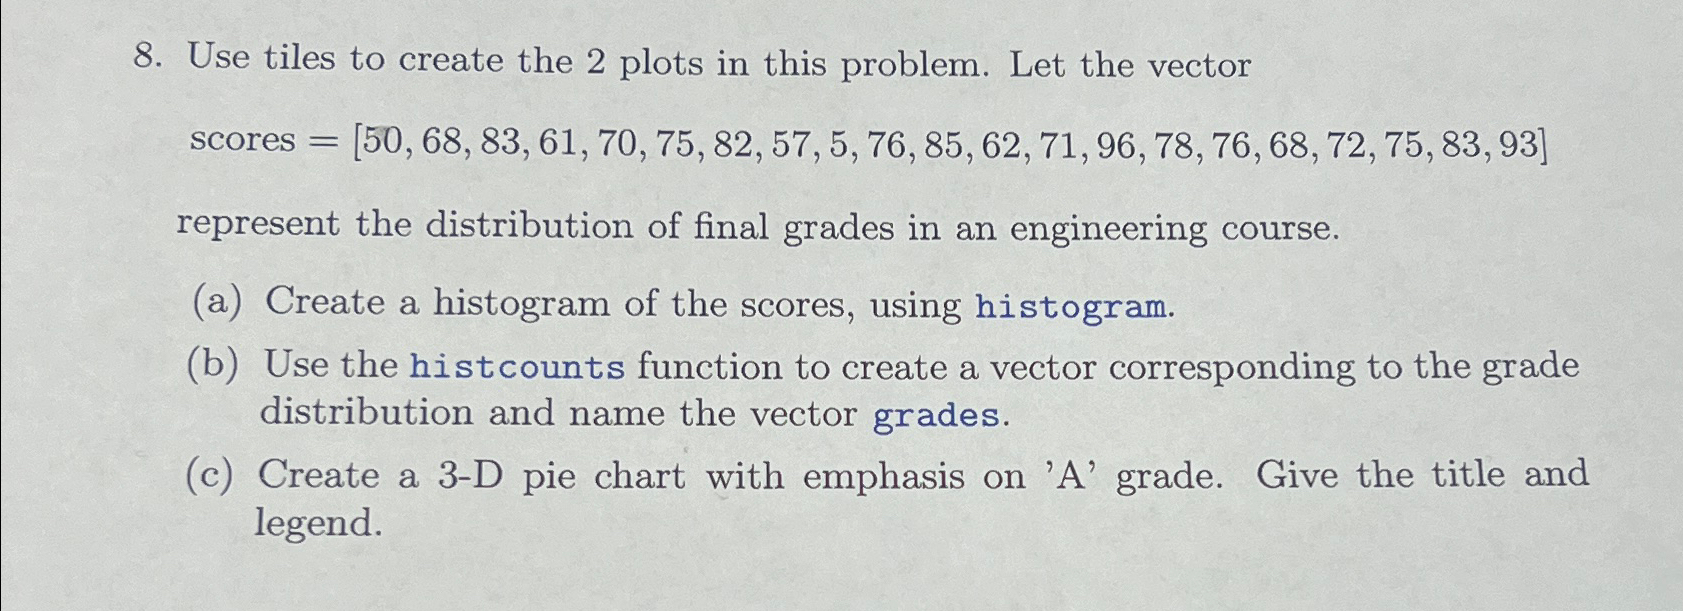
Use tiles to create the plots in this problem. Let the vector
scores
represent the distribution of final grades in an engineering course.
a Create a histogram of the scores, using histogram.
b Use the histcounts function to create a vector corresponding to the grade distribution and name the vector grades.
c Create a D pie chart with emphasis on A grade. Give the title and legend.
Step by Step Solution
There are 3 Steps involved in it
1 Expert Approved Answer
Step: 1 Unlock

Question Has Been Solved by an Expert!
Get step-by-step solutions from verified subject matter experts
Step: 2 Unlock
Step: 3 Unlock