

Question: Use Unit4.csv to create and complete the following summary table: Mean Min Max Standard Deviation Kurtosis Skewness NoOutlier Outlier Please be sure to give
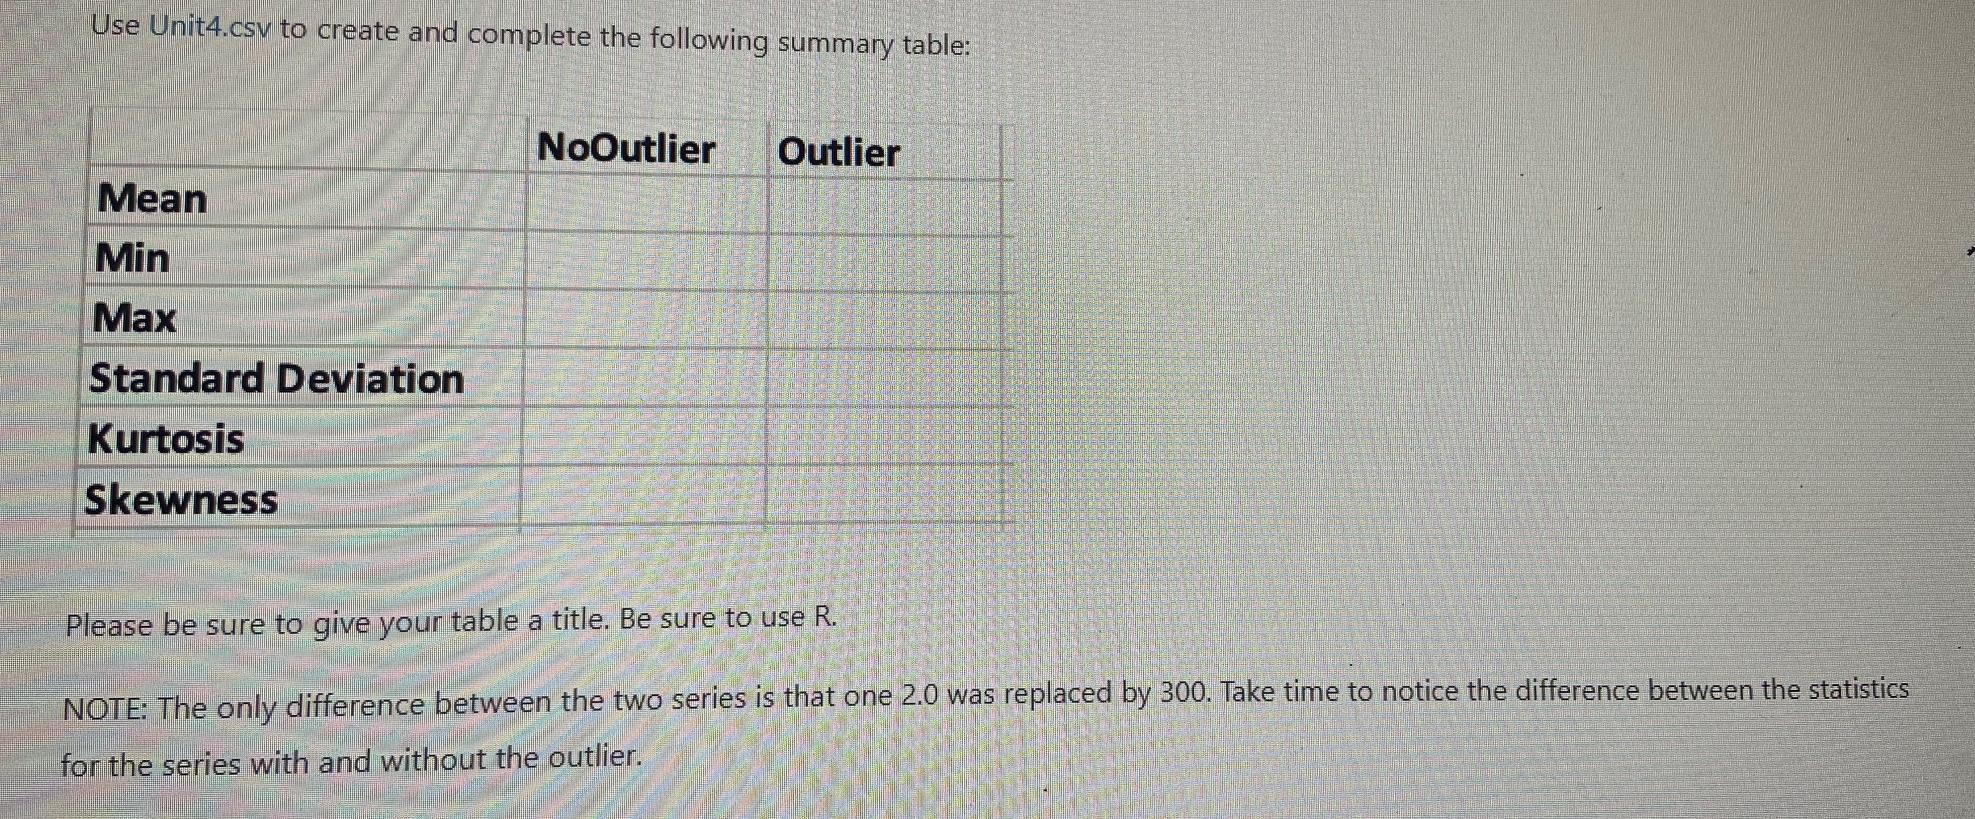
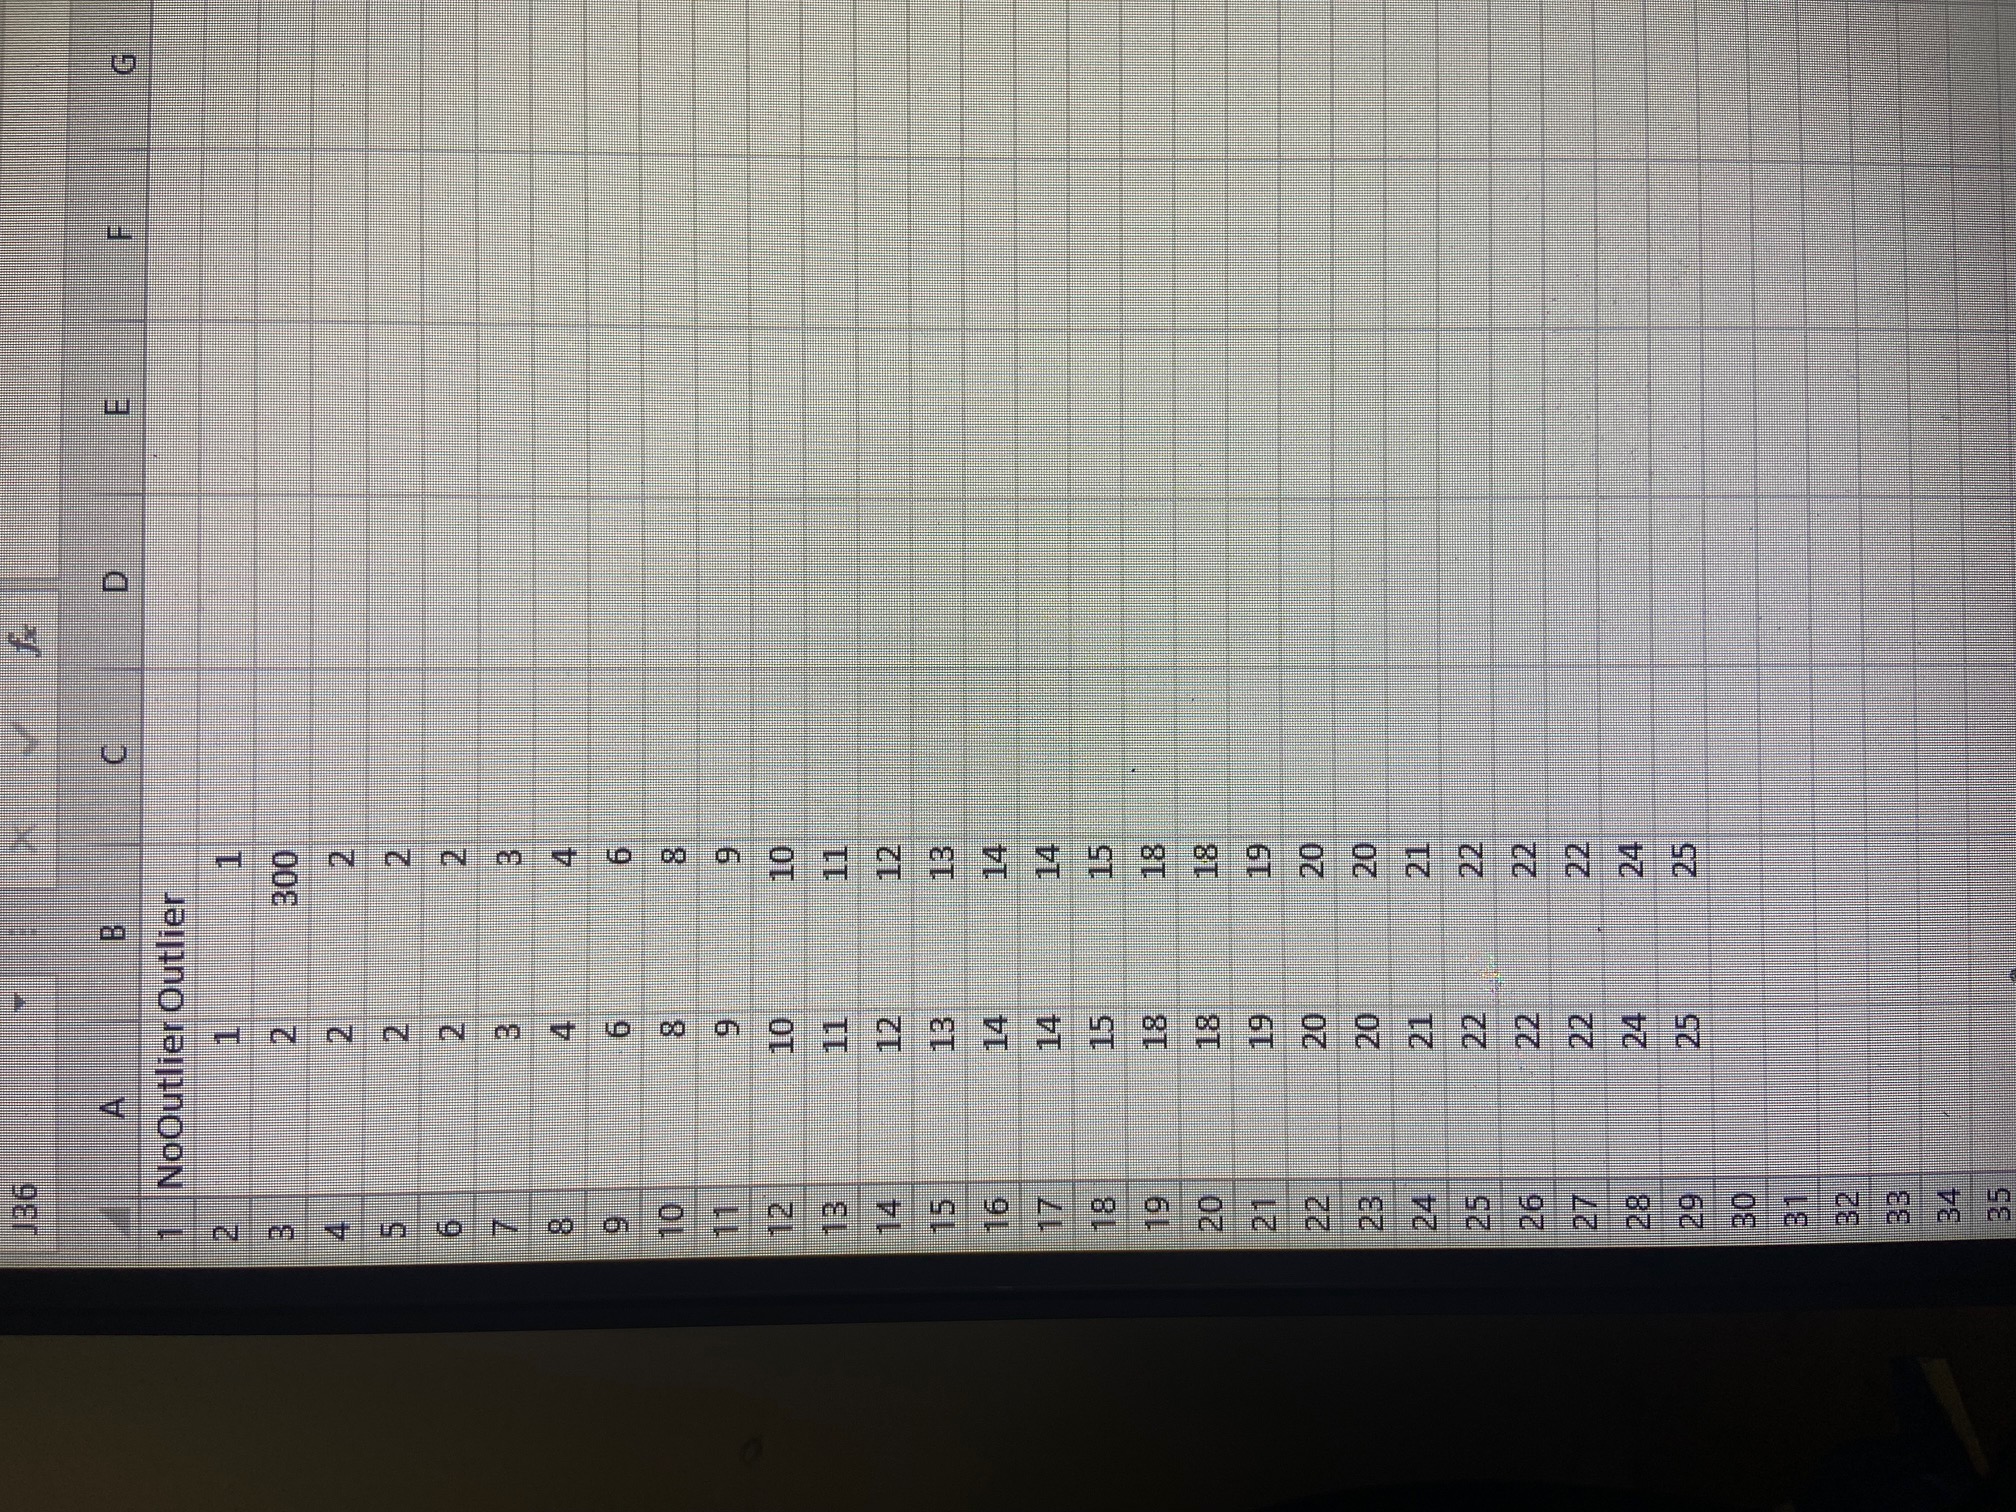
Use Unit4.csv to create and complete the following summary table: Mean Min Max Standard Deviation Kurtosis Skewness NoOutlier Outlier Please be sure to give your table a title. Be sure to use R. NOTE: The only difference between the two series is that one 2.0 was replaced by 300. Take time to notice the difference between the statistics for the series with and without the outlier. J36 A B C 1 NoOutlier Outlier 2 1 1 3 2 300 4 2 2 5 2 N N 6 7 8 19 10 234000 2 3 4 6 6 8 8 11 9 9 12 10 10 13 11 11 14 12 12 15 13 13 16 14 14 17 14 14 18 15 15 19 18 18 20 18 18 21 19 19 22 20 20 23 20 20 24 21 21 25 22 26 22 27 22 28 24 29 25 222 22 2 2 3 22 24 25 30 31 32 34 35 fx F G
Step by Step Solution
There are 3 Steps involved in it
Based on the graphs I would say that c The graph shows the effect of an ... View full answer

Get step-by-step solutions from verified subject matter experts