

Question: Use visual Logic to create a flowchart that models the solution to this problem. A county collects property taxes on the assessment value of property,
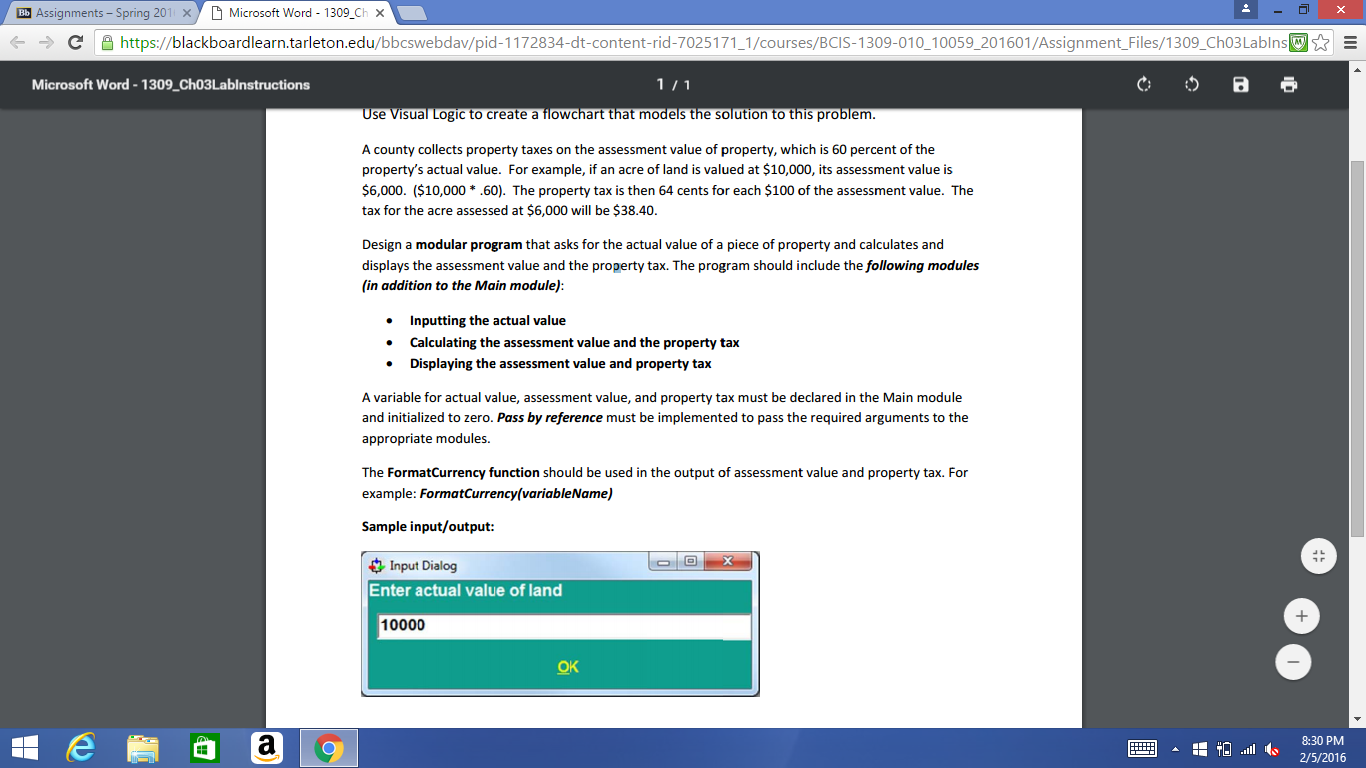
Use visual Logic to create a flowchart that models the solution to this problem. A county collects property taxes on the assessment value of property, which is 60 percent of the property's actual value. For example, if an acre of land is valued at $10,000, its assessment value is $6,000. ($10,000^* .60). The property tax is then 64 cents for each $100 of the assessment value. The tax for the acre assessed at $6,000 will be $38.40. Design a modular program that asks for the actual value of a piece of property and calculates and displays the assessment value and the property tax. The program should include the following modules (in addition to the Main module): Inputting the actual value Calculating the assessment value and the property tax Displaying the assessment value and property tax A variable for actual value, assessment value, and property tax must be declared in the Main module and initialized to zero. Pass by reference must be implemented to pass the required arguments to the appropriate modules. The FormatCurrency function should be used in the output of assessment value and property tax. For example: FormatCurrencyvariableName) Sample input/output
Step by Step Solution
There are 3 Steps involved in it

Get step-by-step solutions from verified subject matter experts