

Question: use with excel formula 7.3 Fill in the spreadsheet below to calculate the port- folio return and risk between Zenon and Dynamics, given the 10
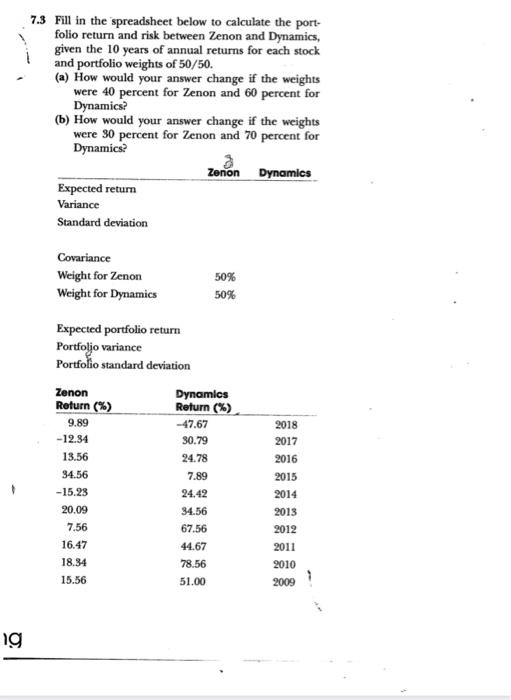
7.3 Fill in the spreadsheet below to calculate the port- folio return and risk between Zenon and Dynamics, given the 10 years of annual returns for each stock and portfolio weights of 50/50. (a) How would your answer change if the weights were 40 percent for Zenon and 60 percent for Dynamics? (b) How would your answer change if the weights were 30 percent for Zenon and 70 percent for Dynamics? Zenon Dynamics Expected return Variance Standard deviation Covariance Weight for Zenon Weight for Dynamics 50% 50% Expected portfolio return Portfoljo variance Portfolio standard deviation Zenon Dynamics Return (%) Return (%) 9.89 -47.67 -12.84 30.79 13.56 24.78 34.56 7.89 - 15.23 24.42 20.09 34.56 7.56 67.56 16.47 44.67 18.34 78.56 15.56 51.00 2018 2017 2016 2015 2014 2013 2012 2011 2010 2009 ig
Step by Step Solution
There are 3 Steps involved in it

Get step-by-step solutions from verified subject matter experts