

Question: Using 2017 Information: What is the total amount vendors and customers owe the company for purchased goods and services on account? $85,113 millions $99,048 millions
Using 2017 Information: 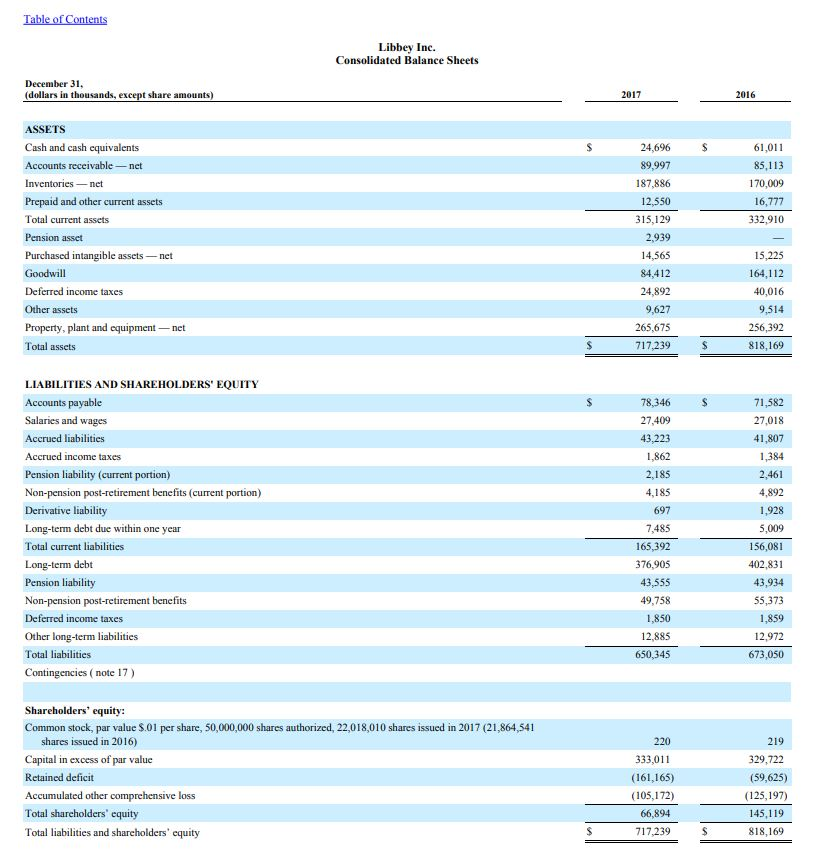
- What is the total amount vendors and customers owe the company for purchased goods and services on account?
|
| $85,113 millions | |
|
| $99,048 millions | |
|
| $9,051 millions | |
|
| No purchases were made on account. All purchases were made with cash. |
1 points
- How much does the company expect to collect from the balance owed on credit sales to vendors and customers?
|
| $89,997 millions | |
|
| $85,113 millions | |
|
| $9,051 millions | |
|
| $21,503 millions |
- How much of the amount owed from vendors and customers is NOT expected to be collected?
|
| $89,997 millions | |
|
| None of it is expected to be collected | |
|
| $9,051 millions | |
|
| $348 millions |
- What amount of bad debts did the company write off during the most recent year?
|
| None | |
|
| $9,051 millions | |
|
| $85,113 millions | |
|
| The amount of bad debts written off represents a deduction to the Allowance for Doubtful Accounts. |
- What was the companys estimate of bad debt expense? What account category on the income statement would include the companys bad debt expense?
|
| $85,113 millions and allowance for doubtful accounts | |
|
| $89,997 millions and sales | |
|
| The company requires payment for goods and services at the time of sale so there is never a bad debt expense. | |
|
| The estimate of bad debt expense represents an addition to the Allowance for Doubtful Accounts. Sales in the appropriate fiscal period. |
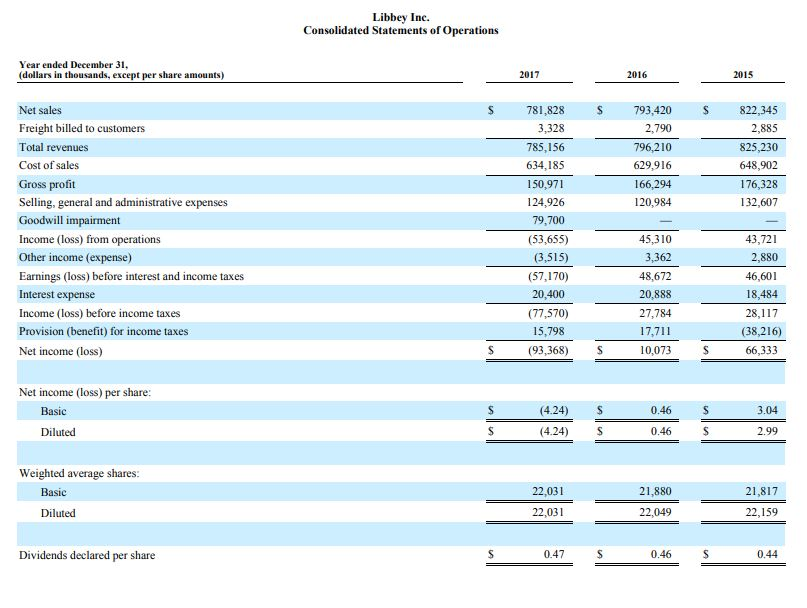
- Calculate the companys Cost of Goods Purchased (CGP) for the most recent reporting period.
|
| $652,062 millions | |
|
| $634,185 millions | |
|
| $187,886 millions | |
|
| $170,009 millions |
Libbey Inc. Consolidated Balance Sheets December 31, (dollars in thousands, e pt share amounts) 2017 2016 ASSETS Cash and cash equivalents Accounts receivable -net Inventoriesnet Prepaid and other current assets Total current assets Pension assct Purchased intangible assets net Goodwill Deferred income taxes Other assets Property, plant and equipment -net Total assets 24,696 89,997 187,886 12,550 315,129 2,939 14,565 84,412 24,892 9,627 265,675 717,239 85,113 170,009 16,777 332,910 15,225 164,112 40,016 256,392 818,169 LIABILITIES AND SHAREHOLDERS' EQUITY Accounts payable Salaries and wages Accrued liabilities Accrued income taxes Pension liability (current portion) Non-pension post-retirement benefits (current portion) Derivative liability Long-term debt due within one year Total current liabilities Long-term debt Pension liability Non-pension post-retirement benefits Deferred income taxes Other long-term liabilities Total liabilities Contingencies ( note 17) 78,346 27,409 43,223 1,862 2,185 4,185 697 7,485 165,392 376,905 43,555 49,758 1,850 12,885 650,345 S 71,582 27,018 1,384 2,461 4,892 1,928 5,009 156,081 43,934 55,373 1,859 12,972 673,050 Shareholders' equity: Common stock, par value $.01 per share, 50,000,000 shares authorized, 22,018,010 shares issued in 2017 (21,864,541 shares issued in 2016) Capital in excess of par value Retained deficit Accumulated other Total shareholders' equity Total liabilities and shareholders' equity 220 333,011 (161,165) (105,172) 66,894 717,239 329,722 (59,625) (125,197) 145,119 818,169 loss Libbey Inc. Consolidated Statements of Operations Year ended December 31, (dollars in thousands, except per share amounts) 2017 2016 2015 Net sales Freight billed to c Total revenues Cost of sales Gross profit Selling, general and administrative expenses Goodwill impairment Income (loss) from operations Other income (expense) Earnings (loss) before interest and incomet Interest expense Income (loss) before income taxes Provision (benefit) for income taxes Net income (loss) S 781,828 S793,420 822,345 2,885 825,230 648,902 176,328 132,607 2,790 796,210 629,916 166,294 120,984 3,328 785,156 634,185 150,971 124,926 79,700 (53,655) (3,515) (57,170) 20,400 (77,570) 15,798 (93,368) 45,310 3,362 48,672 20,888 27,784 17,711 10,073 43,721 2,880 46,601 18,484 28,117 (38,216) 66,333 axes Net income (loss) per share (4.24) S (4.24) 0.46 3.04 Diluted 0.46 2.99 Weighted average shares: 22,031 21,880 21,817 Diluted 22,031 22,049 22,159 Dividends declared per share 0.47 0.46 0.44 Libbey Inc. Consolidated Statements of Comprehensive Income (Loss) Year ended December 31. (dollars in thousands) 2017 2016 2015 Net income (loss) (93,368 S 10,073 66,333 Other comprehensive income (loss): Pension and other post-retirement benefit adjustments, net of tax Change in fair value of derivative instruments, net of tax Foreign currency translation adjustments, net of tax Other 7,514 866 11,645 20,025 (1,395) 1,345 (4,915) (4,965) 33,201 (1,235) (13,751) 18,215 sive income (loss), net of tax Comprehensive income (loss) (73,343) S 5,108 S 84,548 nc. Consolidated Statements of Shareholders Equitv (dollars in thousands, except share amounts) Common Stock Shares Treasury Stoek Shares Common Stoek Amount Capital in Excess of Par Value Treasury Stock Amount Retained Deficit Accumulated Other Comprehensive Loss Total Balance December 31, 2014 21,843,851 34,985S 218 33,39 (1,060) (114,648) $ (138,447) S 77454 66,333 Net income Other comprehensive income (loss) Income tax effect from share-based 66,333 18,215 compensation arrangements Stock compensation expense Stock issued from treasury Stock withheld for emplovee taxes Dividends Purchase of treasury shares Balance December 31, 2015 2,797 5,873 (8,509) (796) 2,797 5,873 3,378 (796) (9,597) (15,275) 148,382 (336,741) 11,887 9,597) 412,473 21,843,851110,717 (15,275) (4,448) 330,756 (5 (120,232) 10,073 Net income Other comprehensive income (loss) Income tax effect from share-based 10,073 (4,965) (4,965) Stock compensation expense Stock issued Stock withheld for emplovee taxes Dividends Purchase of treasury shares Balance December 31, 2016 (534) 3,724 (3,329) (895) (534) 3,724 1,404 (895) (10,070) (2,000) 20,690 (222,009) 6,448 (1,716) (10,070) 111,292 (2,000) 21,864,541 329,722 (59,625) (125,197) 145,119 Cumulative-effect adjustment for the adoption of ASU 2016-09 Net loss Other comprehensive income (loss) Stock compensation expense Stock issued Stock withheld for employee taxes Dividends Balance December 31, 2017 (93,368) 20,025 3,372 (93,368) 20,025 3,372 153,469 (627) (627) (10,355) (10,355) 22,018,010 220 333,0 S - $ (161,165) $ (105,172) S66,894
Step by Step Solution
There are 3 Steps involved in it

Get step-by-step solutions from verified subject matter experts