

Question: Using 2018 data and the calculated WACC in 4a did Starbucks add or detract value using the Economic Value-Added criteria in 2018? How does the
Using 2018 data and the calculated WACC in 4a did Starbucks add or detract value using the Economic Value-Added criteria in 2018?
How does the Return on Invested Capital (ROIC) compare to the WACC?
4a. Ke = Rf + Beta* MRP = 2% + 0.52* (8% - 2%) = 5.12% (Cost of Equity)
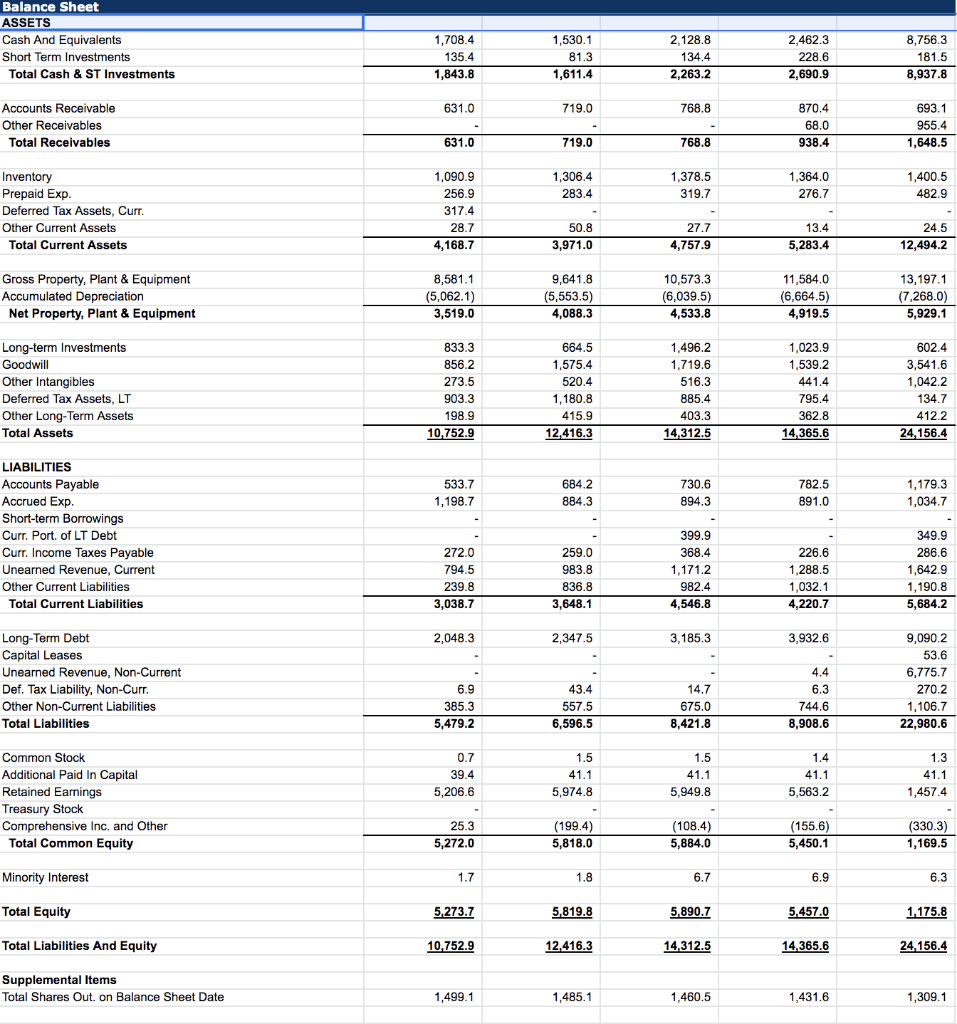
Debt = 9090 (long term debt)
Equity = 1169.5 (Common Equity)
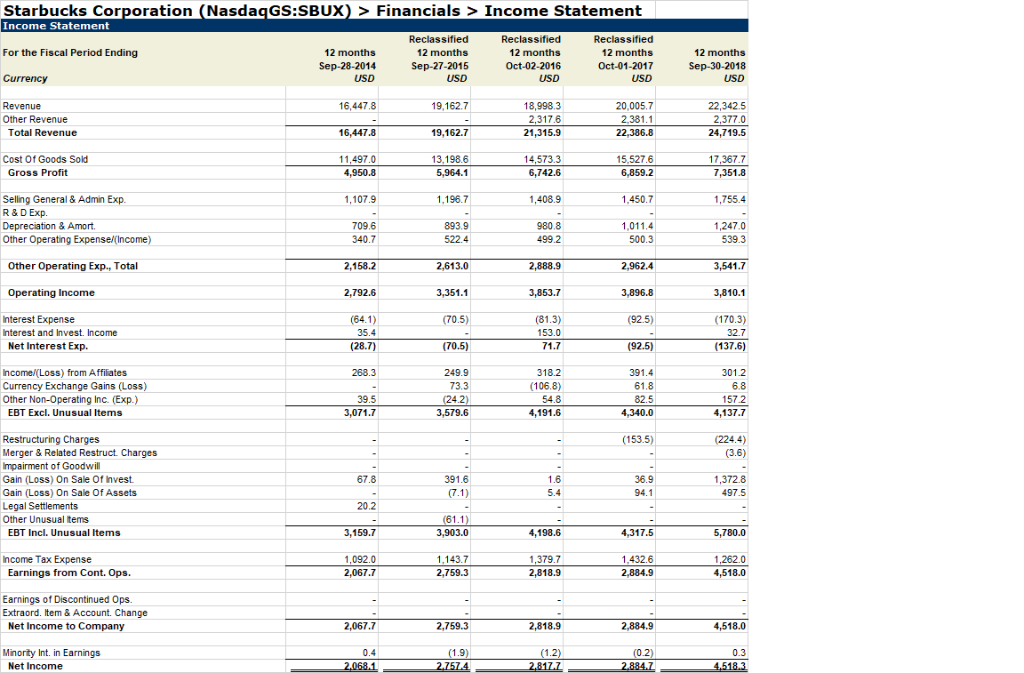
Cost of debt(kd) =? From the balance sheet On debt of $ 3932 , interest expense of $ 170.3 is paid(income statement). So, 170/3932 = 4.32%
Tax rate, tc =? From the income statement, 5780 * tc = 1262 tc = 21.83%
D/V = Wd = 9090/ (9090 + 1169.5) = 88.6%
We=E/V = 11.4%
WACC = 4.32% * 88.6%*(1-22%) + 5.12%* 11.4% = 3.56%
(If image is nonreadable, right click image and hit 'Open image in new tab')
Balance Sheet ASSETS Cash And Equivalents Short Term Investments Total Cash & ST Investments 8,756.3 1,708.4 135.4 1,843.8 1,530.1 81.3 1,611.4 2,128.8 134.4 2,263.2 2,462.3 228.6 2,690.9 181.5 8,937.8 631.0 719.0 768.8 Accounts Receivable Other Receivables Total Receivables 870.4 68.0 938.4 693.1 955.4 1,648.5 631.0 719.0 768.8 1,306.4 283.4 1,378.5 319.7 1,364.0 276.7 1,400.5 482.9 Inventory Prepaid Exp. Deferred Tax Assets, Curr. Other Current Assets Total Current Assets 1,090.9 256.9 317.4 28.7 4,168.7 50.8 3,971.0 27.7 4,757.9 13.4 5,283.4 24.5 12,494.2 Gross Property, Plant & Equipment Accumulated Depreciation Net Property, Plant & Equipment 8,581.1 (5,062.1) 3,519.0 9,641.8 (5,553.5) 4,088.3 10,573.3 (6,039.5) 4,533.8 11,584.0 (6,664.5) 4,919.5 13,197.1 (7,268.0) 5,929.1 Long-term Investments Goodwill Other Intangibles Deferred Tax Assets, LT Other Long-Term Assets Total Assets 833.3 856.2 273.5 903.3 198.9 10,752.9 664.5 1,575.4 520.4 1,180.8 415.9 12,416.3 1,496.2 1,719.6 516.3 885.4 403.3 14,312.5 1,023.9 1,539.2 441.4 795,4 362.8 14,365.6 602.4 3,541.6 1,042.2 134.7 412.2 24.156.4 533.7 1,198.7 684.2 884.3 730.6 894.3 782.5 1,179.3 1,034.7 891.0 LIABILITIES Accounts Payable Accrued Exp. Short-term Borrowings Curr. Port of LT Debt Curr. Income Taxes Payable Unearned Revenue, Current Other Current Liabilities Total Current Liabilities 272.0 794.5 239.8 3,038.7 259.0 983.8 836.8 3,648.1 399.9 368.4 1.171.2 982.4 4,546.8 226.6 1,288.5 1,032.1 4,220.7 349.9 286.6 1,642.9 1,190.8 5,684.2 2,048.3 2.347.5 3,185.3 3,932.6 Long-Term Debt Capital Leases Unearned Revenue, Non-Current Def. Tax Liability, Non-Curr. Other Non-Current Liabilities Total Liabilities 9,090.2 53.6 6,775.7 270.2 1,106.7 22,980.6 6.9 385.3 5,479.2 43.4 557.5 6,596.5 4.4 6.3 744.6 8,908.6 14.7 675.0 8,421.8 0.7 39.4 5,206.6 1.5 41.1 5,974.8 1.5 41.1 5,949.8 1.4 41.1 5,563.2 1.3 41.1 1,457.4 Common Stock Additional Paid In Capital Retained Earnings Treasury Stock Comprehensive Inc. and Other Total Common Equity 25.3 5,272.0 (199.4) 5,818.0 (108.4) 5,884.0 (155.6) 5,450.1 (330.3) 1,169.5 Minority Interest 1.7 1.8 6.7 6.9 6.3 Total Equity 5,273.7 5,819.8 5.890.7 5,457.0 1,175.8 Total Liabilities And Equity 10.752.9 12,416.3 14,312.5 14,365.6 24,156.4 Supplemental Items Total Shares Out. on Balance Sheet Date 1,499.1 1,485.1 1,460.5 1,431.6 1,309.1 Cash Flow For the Fiscal Period Ending 12 months Sep-28-2014 USD 12 months Sep-27-2015 USD Restated 12 months Oct-02-2016 USD Restated 12 months Oct-01-2017 USD 12 months Sep-30-2018 USD Currency Net Income Depreciation & Amort. Amort of Goodwill and Intangibles Depreciation & Amort., Total 2,068.1 739.7 8.7 748.4 2,757.4 883.8 50.0 933.8 2,817.7 972.8 57.3 1,030.1 2,884.7 1.009.6 57.5 1,067.1 4,518.3 1,119.4 186.5 1,305.9 (93.5) (3.7) (390.6) (6.1) - (70.2) (499.2) (1,376,4) 37.6 (16.0) 250.3 87.2 (123.6) 176.0 (43.5) (Gain) Loss From Sale Of Assets (Gain) Loss On Sale Of Invest Asset Writedown & Restructuring Costs (Income) Loss on Equity Invest Stock-Based Compensation Tax Benefit from Stock Options Other Operating Activities Change in Acc. Receivable Change In Inventories Change in Acc. Payable Change in Unearned Rev. Change in Other Net Operating Assets Cash from Ops. ( 183.2 (114.4) ( 46.0 (79.7) 14.3 60.4 140.8 (2.345.6) 607.8 (42.0) 209.8 (132.4) 138.0 (82.8) (207.9) 137.7 170.3 261.5 3,749.1 (26.9) ( 218.1 - 312.0 (55.6) (67.5) 46.9 180.4 248.8 164.2 (96.8) 14.0 46.4 130.8 (4.71 4,251.8 803.6 131.0 (41.2) 391.6 7,109.4 (677.1) 11,937.8 4,697.9 (1.160.9) (1,519.4) (1,303.7) (284.3) Capital Expenditure Cash Acquisitions Divestitures Invest. in Marketable & Equity Securt. Net (Inc.) Dec. in Loans Originated/Sold Other Investing Activities Cash from Investing (1.976.4) (1,311.3) 6082 312.4 (1.440.3) - 69.6 (877.1) - 24.9 (2.222.9) 85.4 529.7 60.9 - 362.3 - (19.1) (817.7) 6.8 (1,520.3) 543 (850.0) 5.6 (2,361.5) - 748.5 748.5 848.5 848.5 1,254.5 1,254.5 750.2 750.2 Short Term Debt issued Long-Term Debt Issued Total Debt Issued Short Term Debt Repaid Long-Term Debt Repaid Total Debt Repaid 5,584.1 5,584.1 (610.1) (610.1) (400.0 (400.0) Issuance of Common Stock Repurchase of Common Stock 139.7 (835.9) 191.8 (1,511.6) 160.7 (2,101.6) 150.8 (2,125.3) 153.9 (7,196.2) Common Dividends Paid Total Dividends Paid (783.1) (783.1) (928.6) (928.6) (1.178.0) (1,178,0) (1,450.4) (1,450.4) (1.743.4) (1,743.4) Special Dividend Paid Other Financing Activities Cash from Financing 107.5 (623.3) (246.5) (2,256.5) (1,872.8) (41.2) (3,242.8) (3,079.1) Foreign Exchange Rate Adj. Net Change in Cash (34.1) (867,3) (150.6) (178.3) (3.5) 598.7 10.8 333.5 (39.5) 6,294.0 Starbucks Corporation (Nasdaq GS:SBUX) > Financials > Income Statement Income Statement For the Fiscal Period Ending Currency 12 months Sep-28-2014 USD Reclassified 12 months Sep-27-2015 USD Reclassified 12 months Oct-02-2016 USD Reclassified 12 months Oct-01-2017 USD 12 months Sep-30-2018 USD 16,447.8 19,162.7 Revenue Other Revenue Total Revenue 18,998.3 2,3176 21,315.9 20.005.7 2,381.1 22,386.8 22,342.5 2,377.0 24,719.5 16,447.8 19,162.7 Cost Of Goods Sold Gross Profit 11.4970 4,950.8 13,198.6 5,964.1 14,573.3 6,742.6 15,527.6 6,859. 17,367.7 7,351.8 1,107,9 1.196.7 1.450.7 1,755.4 Selling General & Admin Exp R&D Exp. Depreciation & Amort. Other Operating Expense/Income) 1,408.9 - 980.8 499.2 709.6 340.7 893.9 5224 1,011,4 500.3 1,247.0 539.3 Other Operating Exp., Total 2,158.2 2,613.0 2,888.9 2,962.4 3,541.7 Operating Income 2,792.6 3,351.1 3,853.7 3,896.8 3,810.1 (70.5) (925) Interest Expense Interest and Invest. Income Net Interest Exp. . (64.1) 35.4 (28.7) ( (81.3) 153.0 71.7 (170.3) 32.7 (137.6) (70.5) (92.5) 268.3 249.9 73.3 Income (Loss) from Affiliates Currency Exchange Gains (Loss) Other Non-Operating Inc. (Exp.) EBT Excl. Unusual Items 318.2 (106.8) 54.8 4,191.6 391.4 61.8 82.5 4,340.0 301.2 6.8 1572 4,137.7 39.5 3,071.7 (24.2) 3,579.6 - (153.5) (224.4) (3.6) 67.8 Restructuring Charges Merger & Related Restruct. Charges Impairment of Goodwill Gain (Loss) On Sale Of Invest Gain (Loss) On Sale Of Assets Legal Settlements Other Unusual Items EBT Incl. Unusual Items 391.6 (7.1) 1.6 5.4 36.9 94.1 1,372.8 497.5 20.2 (61.1) 3,903.0 3,159.7 4,198.6 4,317.5 5,780.0 Income Tax Expense Earnings from Cont. Ops. 1,092.0 2,067.7 1,143.7 2,759.3 1,379.7 2,818.9 1,432.6 2,884.9 1,262.0 4,518.0 Earnings of Discontinued Ops. Extraord. Item & Account Change Net Income to Company 2,067.7 2.759.3 2,818.9 2,884.9 4,518.0 Minority Int. in Earnings Net Income 0.4 2.068.1 (1.9) 2.7574 (1.2) ) 2,8177 (0.2) 2.884.7 0.3 4.518.3
Step by Step Solution
There are 3 Steps involved in it

Get step-by-step solutions from verified subject matter experts