

Question: Using 50 ( ) 70 72, 55, 70 , 66 , 65, 70, 52, 70 90 , 82 70, 76, 90, 80 , 60, 78,
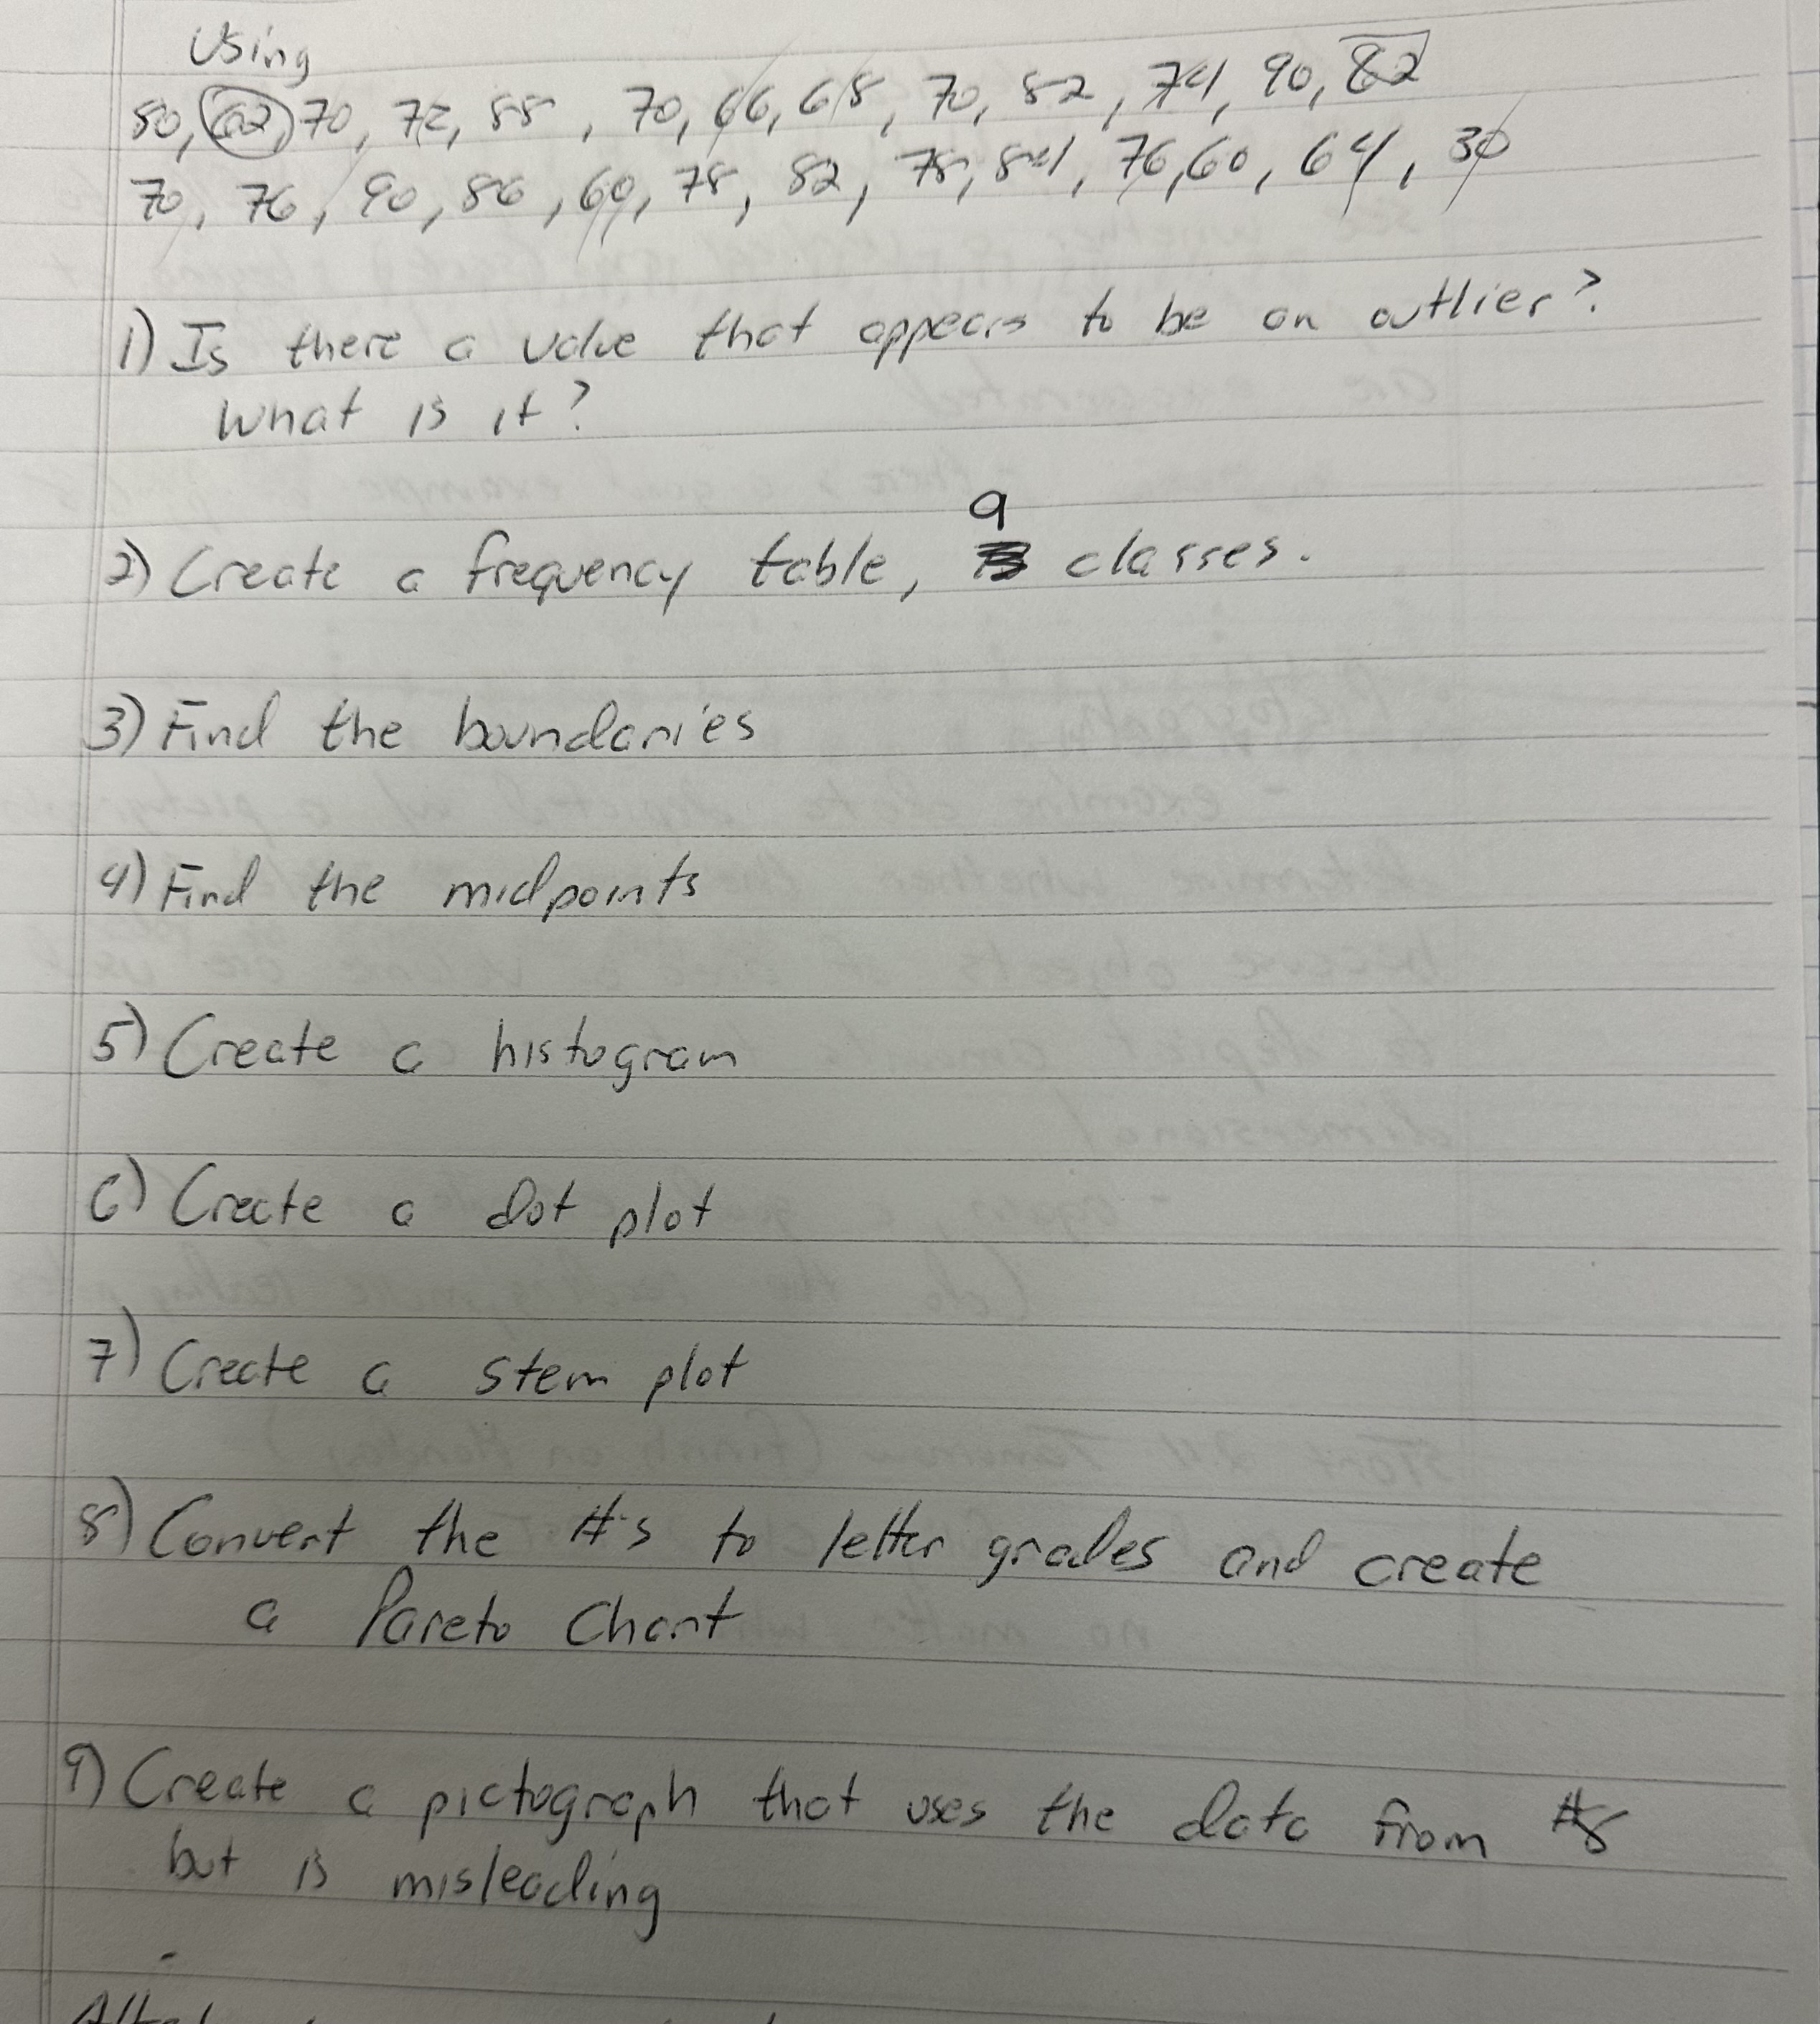
Using 50 ( ) 70 72, 55, 70 , 66 , 65, 70, 52, 70 90 , 82 70, 76, 90, 80 , 60, 78, 52 , 757 51 , 76,60 , 69 , 30 1) Is there a value that appears to be on outlier? what is it ? 2 ) Create a frequency table , classes. 3 ) Find the boundaries 4 ) Find the midpoints 5 ) Create a histogram () Create a dot plot 7 ) Create a stem plot 8) Convert the it's to letter grades and create a Pareto Chant ON 1) Create a pictograph that uses the date from is but is misleading
Step by Step Solution
There are 3 Steps involved in it
1 Expert Approved Answer
Step: 1 Unlock

Question Has Been Solved by an Expert!
Get step-by-step solutions from verified subject matter experts
Step: 2 Unlock
Step: 3 Unlock