

Question: Using a chi-square to see if the differences in conversion rates are statistically significant at the .05 level. discuss the findings of the chi-square test
Using a chi-square to see if the differences in conversion rates are statistically significant at the .05 level. discuss the findings of the chi-square test and the meaning of the p-value in your text box.
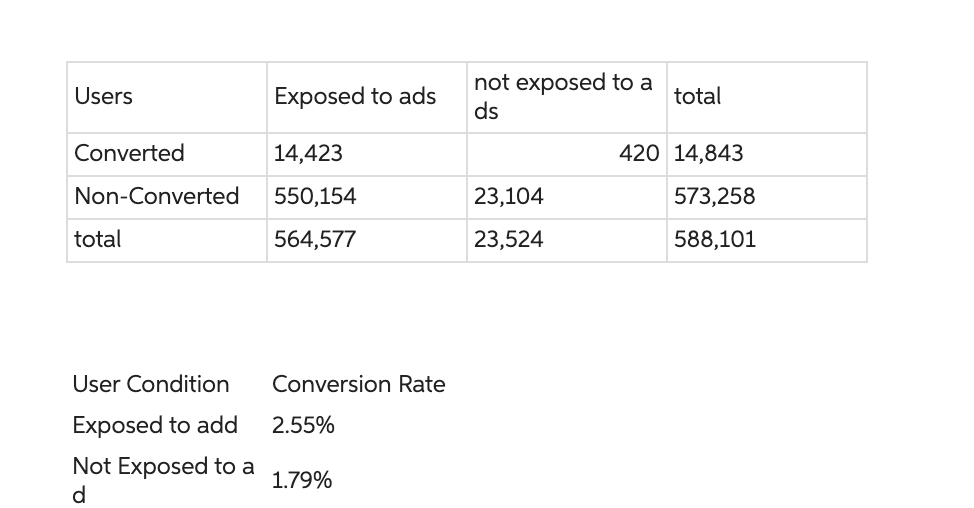
\begin{tabular}{|l|l|l|l|} \hline Users & Exposed to ads & notexposedtoads & total \\ \hline Converted & 14,423 & 420 & 14,843 \\ \hline Non-Converted & 550,154 & 23,104 & 573,258 \\ \hline total & 564,577 & 23,524 & 588,101 \\ \hline \end{tabular} User Condition Conversion Rate Exposed to add 2.55% Not Exposed to a 1.79%
Step by Step Solution
There are 3 Steps involved in it
1 Expert Approved Answer
Step: 1 Unlock

Question Has Been Solved by an Expert!
Get step-by-step solutions from verified subject matter experts
Step: 2 Unlock
Step: 3 Unlock