

Question: Using a for loop, write a script that will create a subplot for every row in the provided matnx. and will plot the numbers from
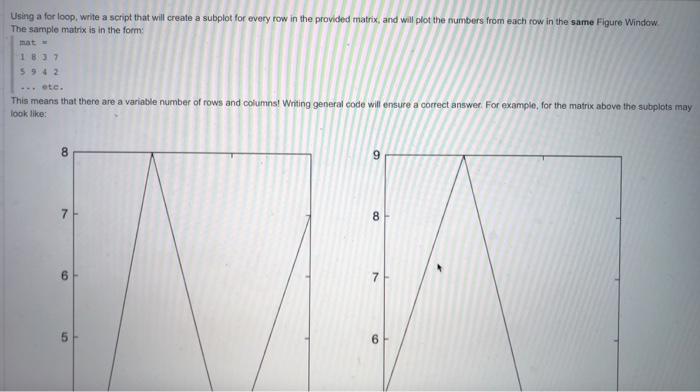
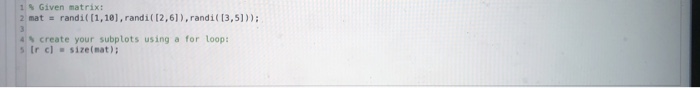
Using a for loop, write a script that will create a subplot for every row in the provided matnx. and will plot the numbers from each row in the same Figure Window. The sample matrix is in the form: mat 1 83 7 5942 ...etc This means that there are a variable number of rows and columns! Wniting general code will ensure a correct answer. For example, for the matrix above the look like: subplots may 9 8 6
Step by Step Solution
There are 3 Steps involved in it
1 Expert Approved Answer
Step: 1 Unlock

Question Has Been Solved by an Expert!
Get step-by-step solutions from verified subject matter experts
Step: 2 Unlock
Step: 3 Unlock