

Question: Using a spreadsheet you have developed, complete a Type II settling analysis. The following data were gathered to design a settling basin. The initial suspended
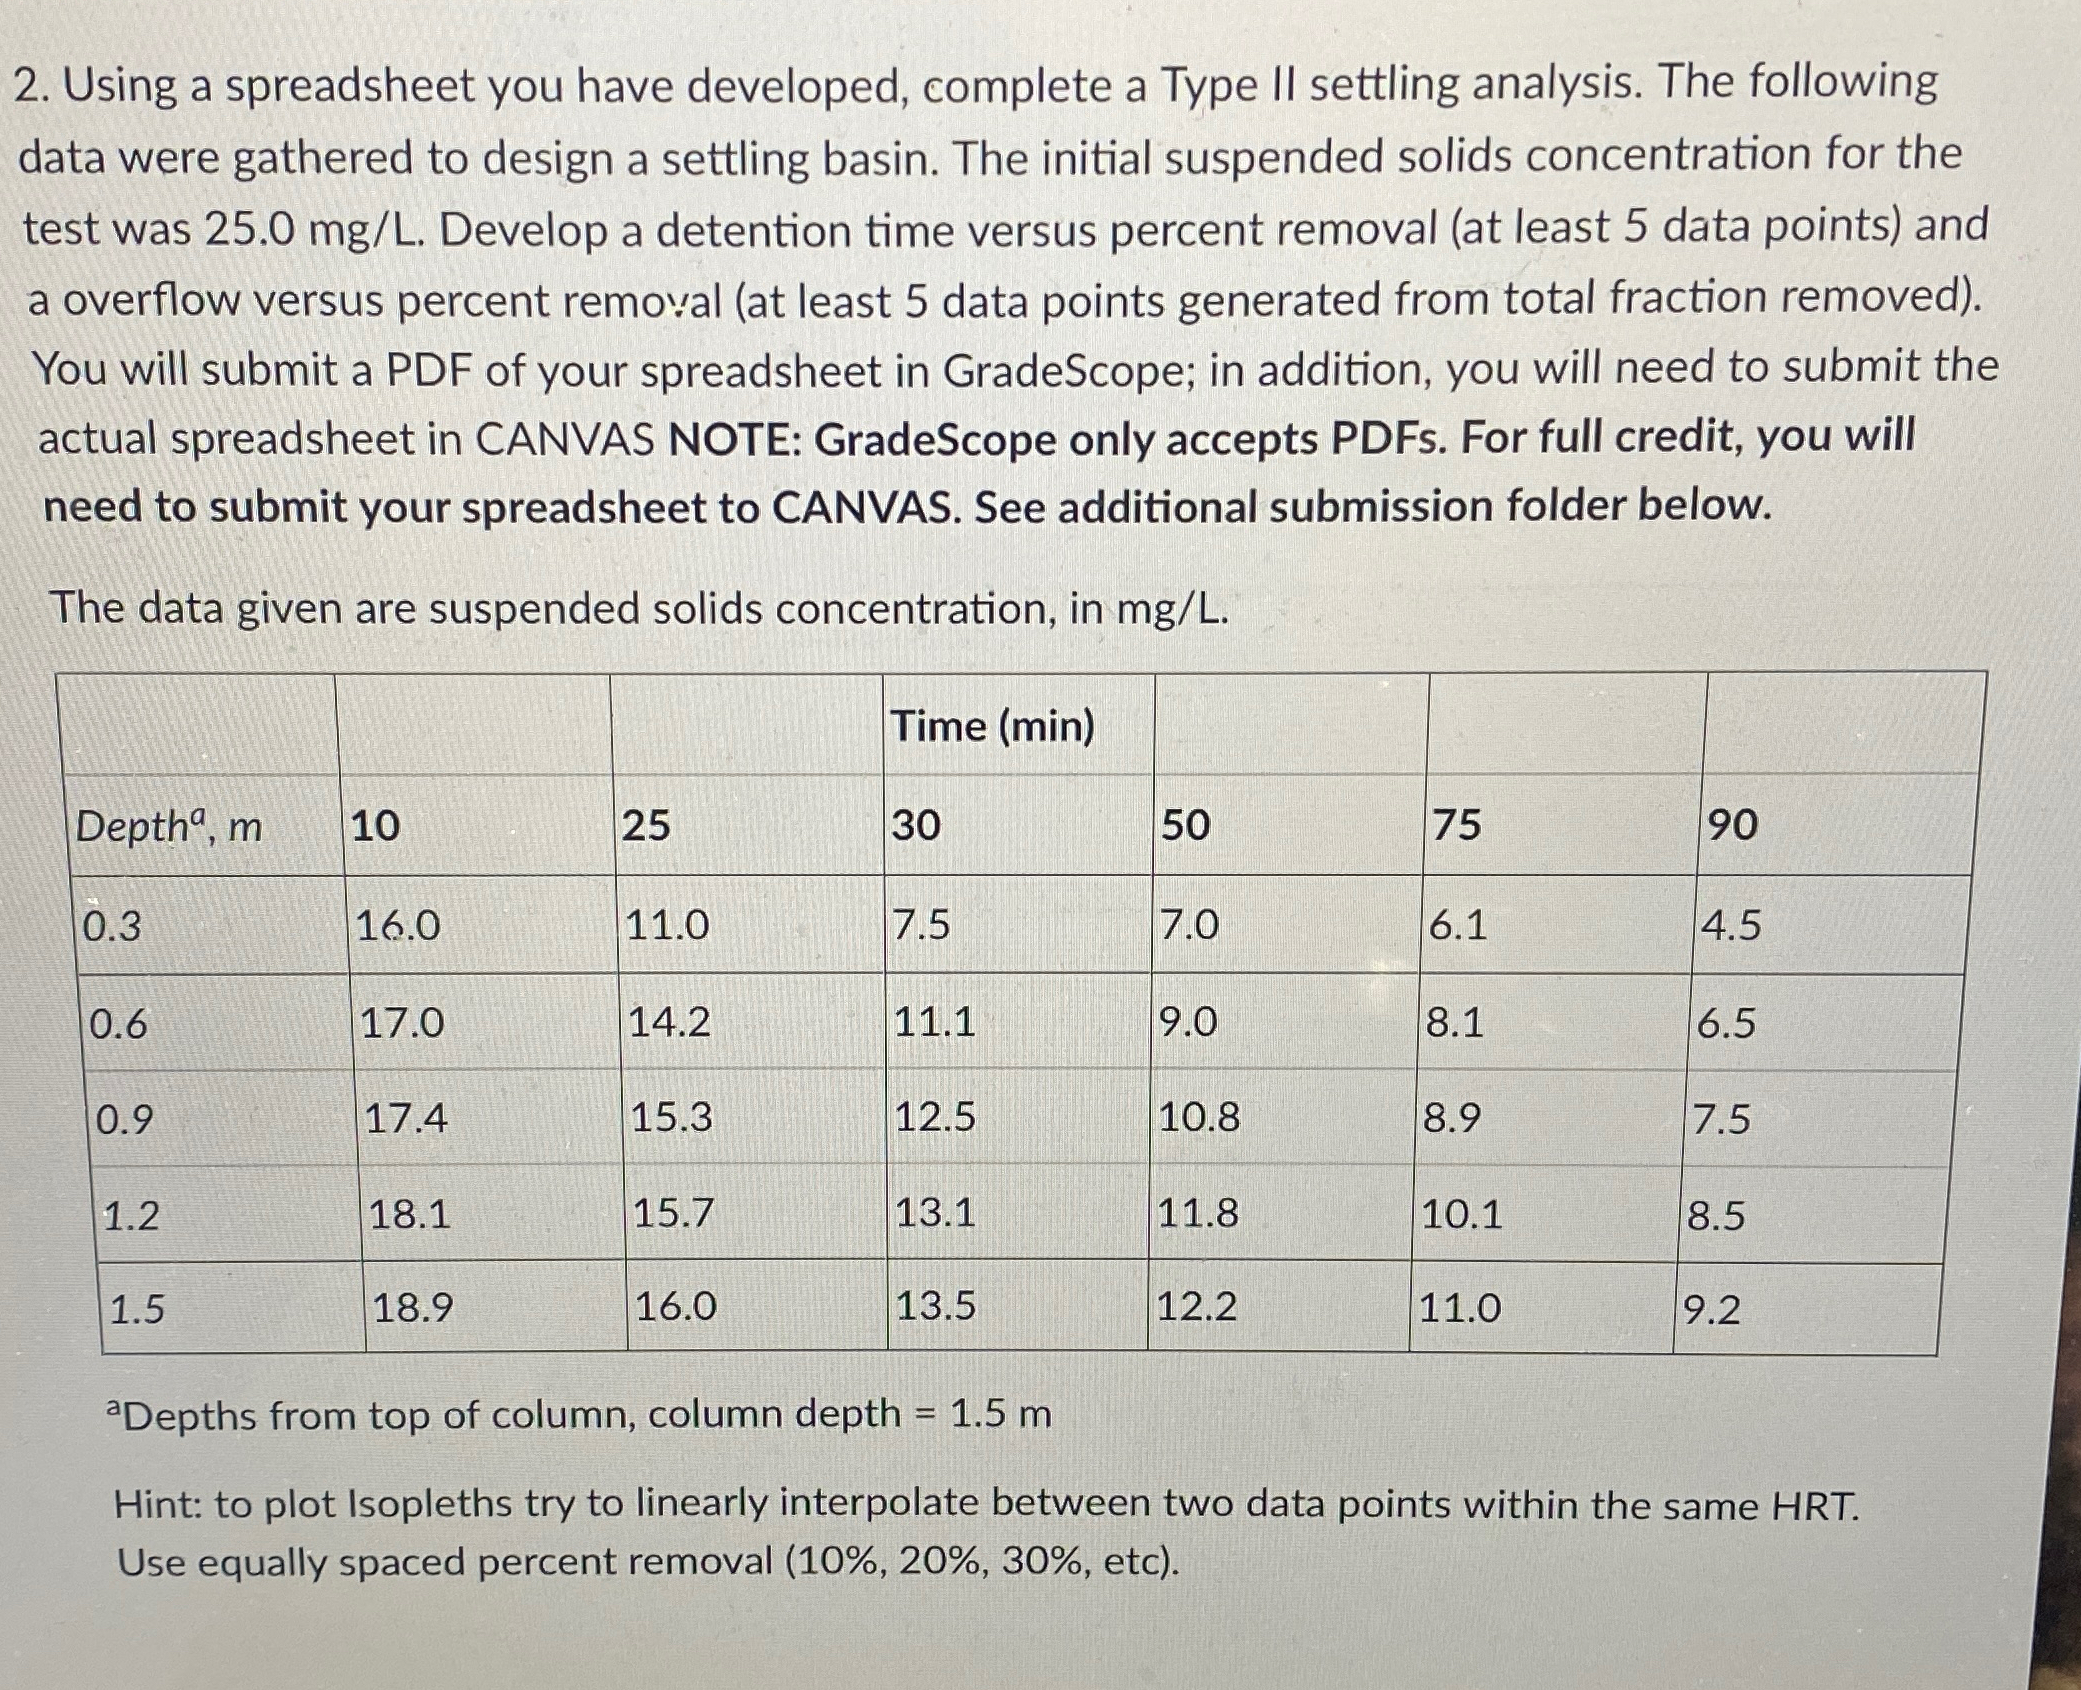
Using a spreadsheet you have developed, complete a Type II settling analysis. The following data were gathered to design a settling basin. The initial suspended solids concentration for the test was Develop a detention time versus percent removal at least data points and a overflow versus percent removal at least data points generated from total fraction removed You will submit a PDF of your spreadsheet in GradeScope; in addition, you will need to submit the actual spreadsheet in CANVAS NOTE: GradeScope only accepts PDFs For full credit, you will need to submit your spreadsheet to CANVAS. See additional submission folder below.
The data given are suspended solids concentration, in
tableTime minDepth
aDepths from top of column, column depth
Hint: to plot Isopleths try to linearly interpolate between two data points within the same HRT Use equally spaced percent removal etc
Step by Step Solution
There are 3 Steps involved in it
1 Expert Approved Answer
Step: 1 Unlock

Question Has Been Solved by an Expert!
Get step-by-step solutions from verified subject matter experts
Step: 2 Unlock
Step: 3 Unlock