

Question: Using a Stock Price Chart, provide a brief 3 - 4 paragraph discussion of the stock trend for The Cheesecake Factory (CAKE) for the years
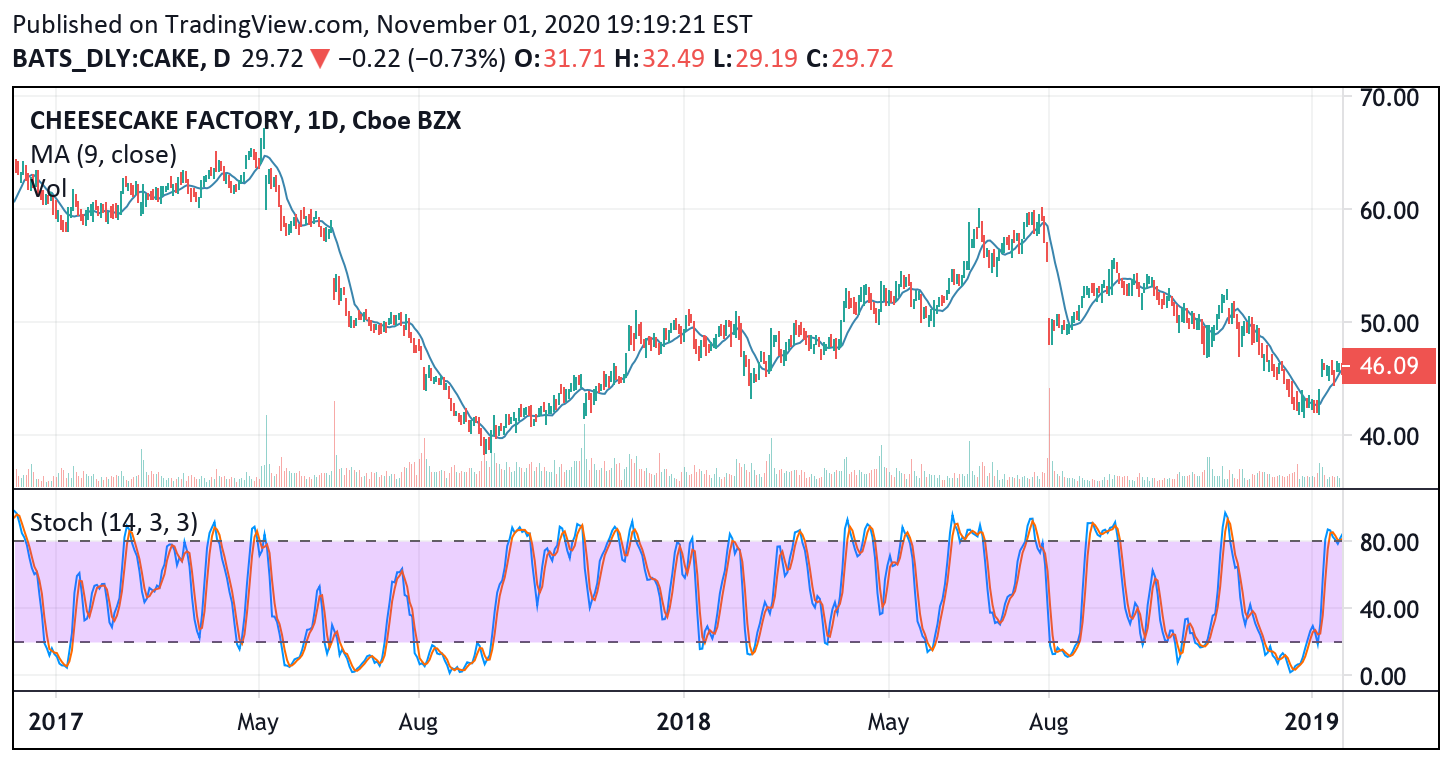 Using a Stock Price Chart, provide a brief 3 - 4 paragraph discussion of the stock trend for The Cheesecake Factory (CAKE) for the years 2017-2019. What are the peak highs and lows? What happend during these periods? Is there something that can be identified through the financial analysis that might explain changes? What about the bigger environment such as economic changes or political factors?
Published on TradingView.com, November 01, 2020 19:19:21 EST BATS_DLY:CAKE, D 29.72 V -0.22 (-0.73%) 0:31.71 H:32.49 L:29.19 C:29.72 70.00 CHEESECAKE FACTORY, 1D, Cboe BZX MA (9, close) 60.00 What 50.00 Hulu- 46.09 40.00 Her er en het gehele har Stoch (14, 3, 3) 80.00 40.00 0.00 2017 May Aug 2018 May Aug 2019 Published on TradingView.com, November 01, 2020 19:19:21 EST BATS_DLY:CAKE, D 29.72 V -0.22 (-0.73%) 0:31.71 H:32.49 L:29.19 C:29.72 70.00 CHEESECAKE FACTORY, 1D, Cboe BZX MA (9, close) 60.00 What 50.00 Hulu- 46.09 40.00 Her er en het gehele har Stoch (14, 3, 3) 80.00 40.00 0.00 2017 May Aug 2018 May Aug 2019
Step by Step Solution
There are 3 Steps involved in it

Get step-by-step solutions from verified subject matter experts