

Question: Using a t-distribution table or software or a calculator, report the 1-statistic which is multiplied by the standard error to form the margin of
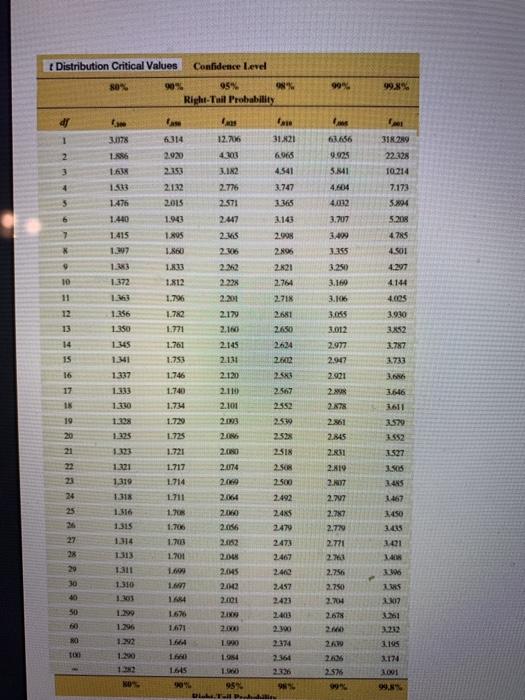
Using a t-distribution table or software or a calculator, report the 1-statistic which is multiplied by the standard error to form the margin of error for the following cases, a. 90% confidence interval for a mean with 16 observations. b. 90% confidence interval for a mean with 26 observations. c. 99% confidence interval for a mean with 26 observations. Click the icon to view the 1-distribution table. a. t= (Round to three decimal places as needed.) b.t (Round to three decimal places as needed.) (Round to three decimal places as needed.) G. 1 t Distribution Critical Values 80% 123 TOP 10 11 12 13 14 15 16 17 18 19 20 21 22 23 24 25 26 27 28 29 30 40 50 09 80 100 5.300 3.1178 1.886 1.638 1.533 1.476 1.440 1.415 1.397 1.383 1.372 1.363 1.356 1.350 1.345 1.341 1.337 1.333 1.330 1.328 1.325 1.323 1.321 1,319 1.318 1.316 1.315 1.314 1313 1.311 1.310 1.303 1.296 1.292 1.290 1282 80% 90% Case 6.314 2.920 2.353 2.132 2015 1.943 1.805 1,860 Right-Tail Probability 1.833 1.812 1.796 1.782 1.771 1.761 1.753 1.746 1.740 1.734 1.729 1.725 1.721 1.717 1.714 1.711 1.708 1.706 1.703 1.701 1.699 1.697 1.684 1676 1,671 1.664 1660 1.645 Confidence Level 90% 95% las 12.706 4.303 3.182 2.776 2.571 2.447 2.365 2.306 2.262 2.228 2.201 2.179 2.160 2.145 2.131 2.120 2.110 2.101 2.086 2.080 2.074 2.069 2.064 2.060 2.056 2.052 2.048 2.045 2042 2001 2009 2.000 1.990 1.984 1960 98% fase 31.821 6.965 4,541 3.747 3.365 3.143 2.998 2.896 2.821 2.764 2.718 2.681 2.650 2624 2.602 2.583 2.567 2.552 2.539 2.528 2518 2.508 2.500 2.492 2485 2479 2473 2467 2.462 2457 2.423 24013 2.390 2.374 2.364 2.326 95% Diskt Full Probabilit 98% 99% fe 63.656 9.925 5.841 4,604 4032 3.707 3,499 3.355 3.250 3.160 3.106 3,055 3.012 2.977 2.947 2.921 2.898 2.878 2.861 2.845 2.831 2.819 2.817 2.747 2.787 2.779 2.771 2.763 2.756 2.750 2.704 2.678 2.660 2.639 2626 2.576 99% P 99.8% 01 318.289 22.328 10.214 7.173 5.894 5.208 4.785 4.501 4.297 4.144 4.025 3.930 3.852 3.787 3.733 3.686 3646 3611 3.579 552 3.527 3.505 3.485 3467 3,450 3.435 3421 3408 3.306 3.385 3.307 3261 3.232 3.195 3.174 3.001 99,8%
Step by Step Solution
3.32 Rating (149 Votes )
There are 3 Steps involved in it
90 90 Confidence interval for a mean with 16 observation df n 1 16 1 1... View full answer

Get step-by-step solutions from verified subject matter experts