

Question: Using Ampol Australia's Dividend, Prices and Share Valuation excel sheets provided and: 1. Calculate percentage returns per month 2. Estimate beta using the monthly
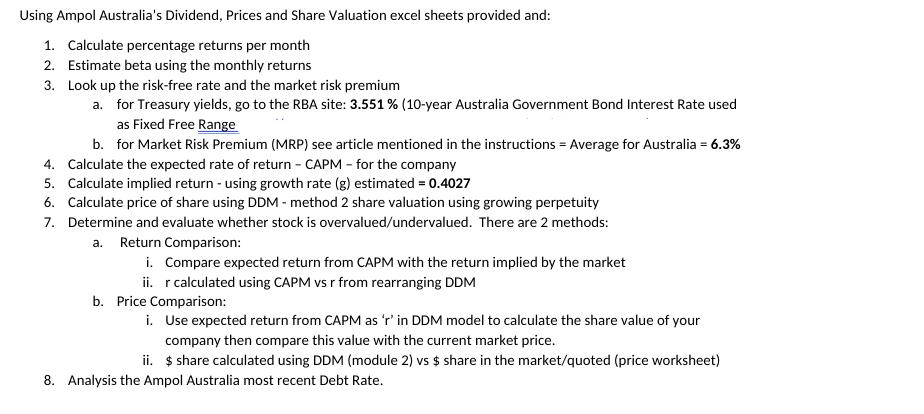
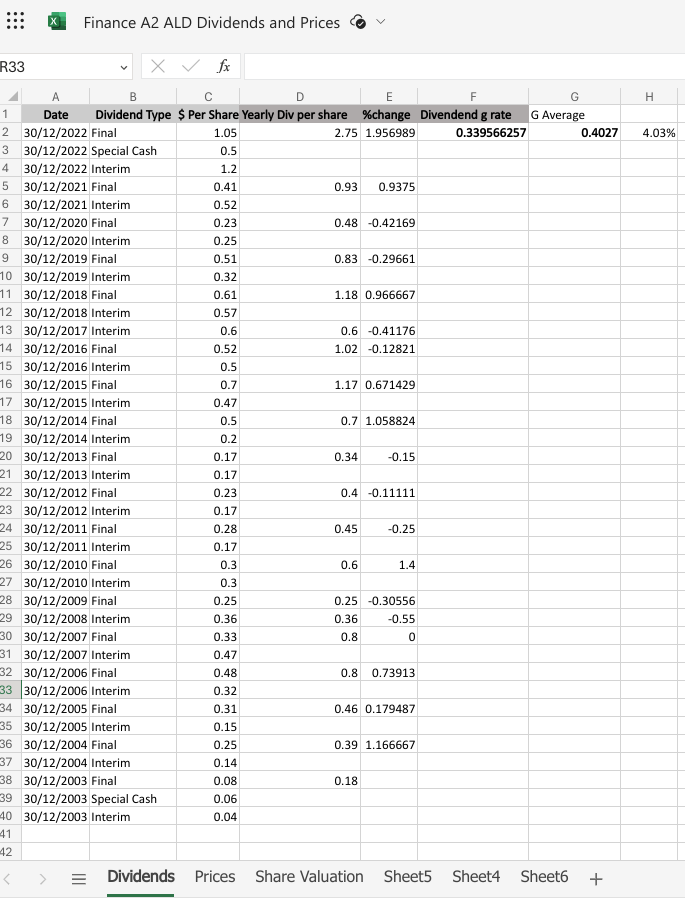
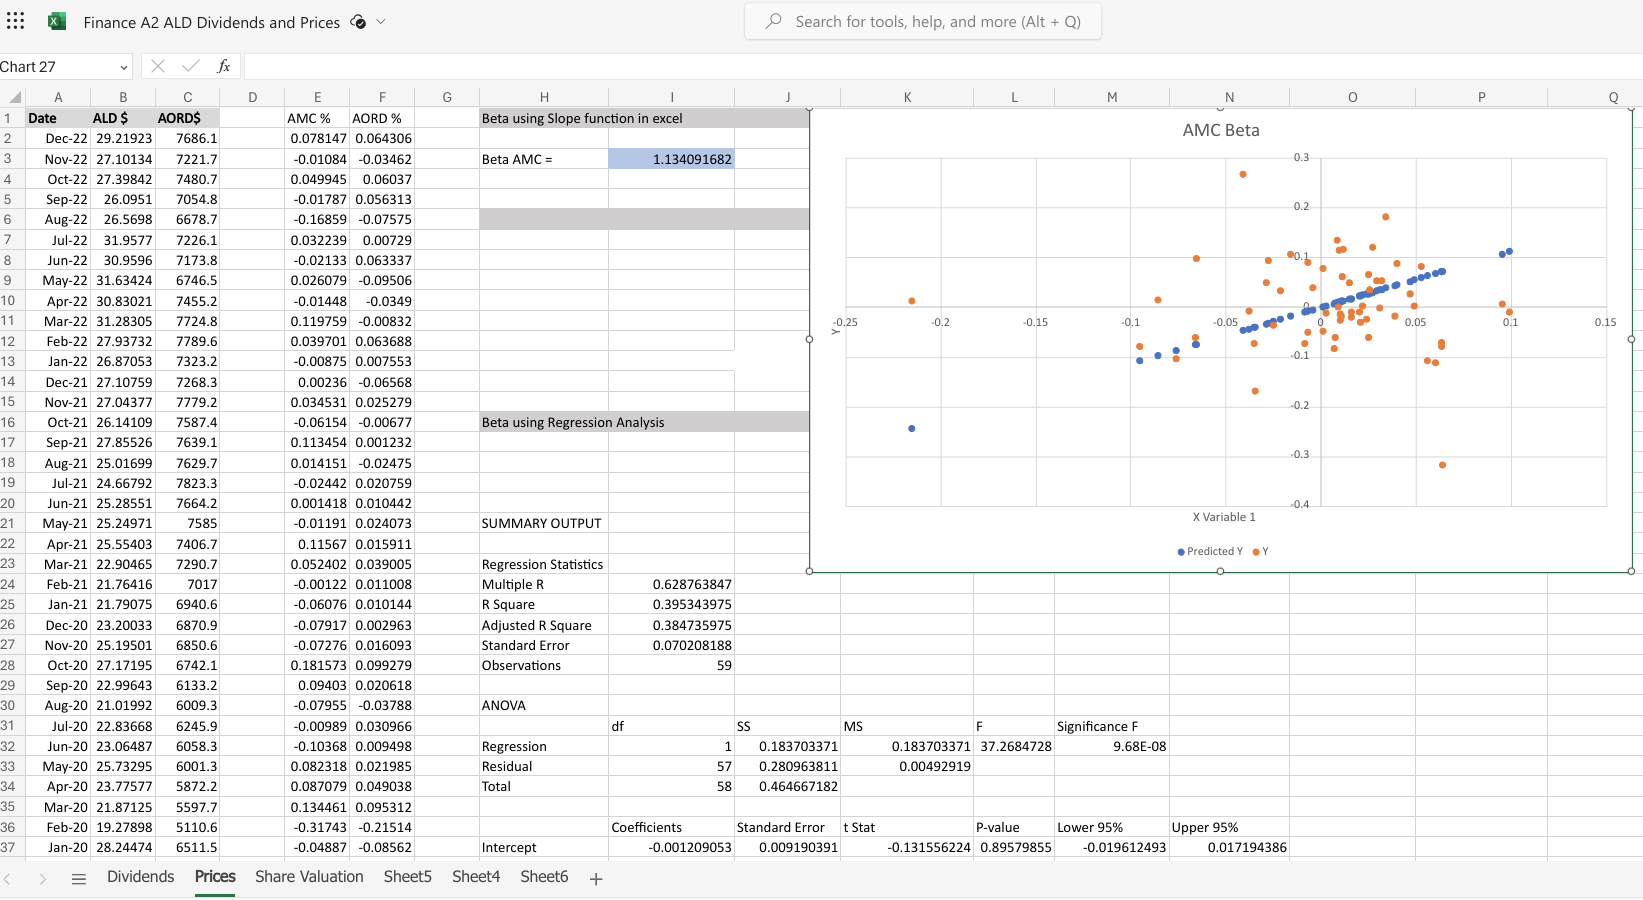
Using Ampol Australia's Dividend, Prices and Share Valuation excel sheets provided and: 1. Calculate percentage returns per month 2. Estimate beta using the monthly returns 3. Look up the risk-free rate and the market risk premium a. for Treasury yields, go to the RBA site: 3.551 % (10-year Australia Government Bond Interest Rate used as Fixed Free Range b. for Market Risk Premium (MRP) see article mentioned in the instructions = Average for Australia = 6.3% 4. Calculate the expected rate of return - CAPM - for the company 5. Calculate implied return - using growth rate (g) estimated = 0.4027 6. Calculate price of share using DDM- method 2 share valuation using growing perpetuity 7. Determine and evaluate whether stock is overvalued/undervalued. There are 2 methods: a. Return Comparison: i. Compare expected return from CAPM with the return implied by the market ii. r calculated using CAPM vs r from rearranging DDM b. Price Comparison: i. Use expected return from CAPM as 'r' in DDM model to calculate the share value of your company then compare this value with the current market price. ii. $ share calculated using DDM (module 2) vs $ share in the market/quoted (price worksheet) 8. Analysis the Ampol Australia most recent Debt Rate. R33 1 A Date Finance A2 ALD Dividends and Prices X fx B E H 0.4027 4.03% 1.05 0.5 Dividend Type $ Per Share Yearly Div per share %change Divendend g rate G Average 2 30/12/2022 Final 3 30/12/2022 Special Cash 2.75 1.956989 0.339566257 4 30/12/2022 Interim 1.2 5 30/12/2021 Final 0.41 0.93 0.9375 6 30/12/2021 Interim 0.52 7 30/12/2020 Final 0.23 0.48 -0.42169 8 30/12/2020 Interim 0.25 9 30/12/2019 Final 0.51 0.83 -0.29661 10 30/12/2019 Interim 0.32 11 30/12/2018 Final 0.61 1.18 0.966667 12 30/12/2018 Interim 0.57 13 30/12/2017 Interim 0.6 0.6 -0.41176 14 30/12/2016 Final 0.52 1.02 -0.12821 15 30/12/2016 Interim 0.5 16 30/12/2015 Final 0.7 1.17 0.671429 17 30/12/2015 Interim 0.47 18 30/12/2014 Final 0.5 0.7 1.058824 19 30/12/2014 Interim 0.2 20 30/12/2013 Final 0.17 0.34 -0.15 21 30/12/2013 Interim 0.17 22 30/12/2012 Final 0.23 0.4 -0.11111 23 30/12/2012 Interim 0.17 24 30/12/2011 Final 0.28 0.45 -0.25 25 30/12/2011 Interim 0.17 26 30/12/2010 Final 0.3 0.6 1.4 27 30/12/2010 Interim 0.3 28 30/12/2009 Final 0.25 0.25 -0.30556 29 30/12/2008 Interim 0.36 0.36 30 30/12/2007 Final 0.33 0.8 -0.55 0 31 30/12/2007 Interim 0.47 32 30/12/2006 Final 0.48 0.8 0.73913 33 30/12/2006 Interim 0.32 34 30/12/2005 Final 0.31 0.46 0.179487 35 30/12/2005 Interim 0.15 36 30/12/2004 Final 0.25 0.39 1.166667 37 30/12/2004 Interim 0.14 38 30/12/2003 Final 0.08 0.18 39 30/12/2003 Special Cash 0.06 40 30/12/2003 Interim 0.04 41 42 < > = Dividends Prices Share Valuation Sheet5 Sheet4 Sheet6 + ::: Finance A2 ALD Dividends and Prices Search for tools, help, and more (Alt + Q) 0.1 Chart 27 x fx A B C D E F G H J K N 1 Date ALD $ AORD$ 2 Dec-22 29.21923 7686.1 3 Nov-22 27.10134 7221.7 4 Oct-22 27.39842 7480.7 AMC % AORD % 0.078147 0.064306 -0.01084 -0.03462 0.049945 0.06037 Beta using Slope function in excel Beta AMC = 1.134091682 AMC Beta 0.3 5 Sep-22 26.0951 7054.8 -0.01787 0.056313 0.2 6 Aug-22 26.5698 6678.7 -0.16859 -0.07575 7 Jul-22 31.9577 7226.1 0.032239 0.00729 8 Jun-22 30.9596 7173.8 -0.02133 0.063337 9 May-22 31.63424 6746.5 0.026079 -0.09506 10 Apr-22 30.83021 7455.2 -0.01448 -0.0349 11 Mar-22 31.28305 7724.8 0.119759 -0.00832 -0.25 -0.2 -0.15 -0.1 -0.05 12 Feb-22 27.93732 7789.6 0.039701 0.063688 13 Jan-22 26.87053 7323.2 -0.00875 0.007553 14 Dec-21 27.10759 7268.3 0.00236 -0.06568 15 Nov-21 27.04377 7779.2 0.034531 0.025279 -0.2 16 Oct-21 26.14109 7587.4 -0.06154 -0.00677 Beta using Regression Analysis 17 Sep-21 27.85526 7639.1 0.113454 0.001232 -0.3 18 Aug-21 25.01699 7629.7 19 Jul-21 24.66792 7823.3 20 Jun-21 25.28551 7664.2 0.014151 -0.02475 -0.02442 0.020759 0.001418 0.010442 21 May-21 25.24971 7585 -0.01191 0.024073 -0.4 X Variable 1 SUMMARY OUTPUT 22 Apr-21 25.55403 7406.7 23 Mar-21 22.90465 7290.7 24 Feb-21 21.76416 7017 25 Jan-21 21.79075 6940.6 26 Dec-20 23.20033 6870.9 27 Nov-20 25.19501 6850.6 0.11567 0.015911 0.052402 0.039005 -0.00122 0.011008 -0.06076 0.010144 -0.07917 0.002963 -0.07276 0.016093 Predicted Y. Y Regression Statistics Multiple R 0.628763847 R Square 0.395343975 Adjusted R Square 0.384735975 Standard Error 0.070208188 28 Oct-20 27.17195 6742.1 0.181573 0.099279 Observations 59 29 Sep-20 22.99643 6133.2 30 Aug-20 21.01992 6009.3 0.09403 0.020618 -0.07955 -0.03788 ANOVA 31 Jul-20 22.83668 6245.9 -0.00989 0.030966 df SS MS F Significance F 32 Jun-20 23.06487 6058.3 -0.10368 0.009498 33 May-20 25.73295 6001.3 0.082318 0.021985 34 Apr-20 23.77577 5872.2 0.087079 0.049038 Regression Residual Total 1 57 0.183703371 0.280963811 0.183703371 37.2684728 0.00492919 9.68E-08 58 0.464667182 35 Mar-20 21.87125 5597.7 0.134461 0.095312 36 Feb-20 19.27898 5110.6 37 Jan-20 28.24474 6511.5 -0.31743 -0.21514 -0.04887 -0.08562 Intercept Coefficients Standard Error t Stat -0.001209053 0.009190391 P-value -0.131556224 0.89579855 Lower 95% Upper 95% -0.019612493 0.017194386 < = Dividends Prices Share Valuation Sheet5 Sheet4 Sheet6 + 0.05 0.1 0.15 . Q Finance A2 ALD Dividends and Prices Search for tools, help, and more (- C31 fx =C27/(C29-C28) B E F H K M N 1 Valuation of AMC as at 30 December 2022 2 Using g average 3. 4 5 CAPM r%= Method 1 - compare CAPM r with implied r observed in the market CAPM Rf+B (Rm-Rf) Using g from dividends Method 1 - compare CAPM r with implied r observed in the market 6 7 Rf = 3.551 RBA website 8 Beta = 1.134092 calculated 9 MRP = 6.3 see article 0 1 CAPM r = 6.668618 666.86% 2 3 Implied r%= Implied r = +9 4 5 g average = 0.04027 calculated 6 P zero (market) = 29.21923 price worksheet 7 D zero= 18 D1= 9 20 Implied r= 0.138176 13.82% 21 2.75 dividend worksheet 2.861 calculated 22 Method 2-compare DDM $ with observed Market $ 23 24 DDM $= DDM P = D D zero = D1= Implied r = 0.094116 9.41% Method 2 - compare DDM $ with observed Market $ DDM $ = D DDM = P = 1-9 CAPM r = 6.668618 666.86% Implied r%= Implied r = D +9 Po g from div = P zero (market) = 29.21923 2.75 2.750 25 26 27 D1= 28 g average = 2.861 calculated 0.04027 calculated 6.668618 CAPM 29 r 30 31 DDMS= 32 Market $= 33 0.431592 calculated 29.21923 price worksheet 34 Method 2 is valied if growth rate is less than r 35 36 37 38 39 10 D1 = 2.750 g from div= 0 r = 6.668618 DDMS = 0.412379 Market $ = 29.21923 1 12 < > = Dividends Prices Share Valuation Sheet5 Sheet4 Sheet6 + P Q
Step by Step Solution
There are 3 Steps involved in it

Get step-by-step solutions from verified subject matter experts