

Question: Using an excel spreadsheet and the calculations you have done above, prepare a spreadsheet that provides the expected returns and the risk for a portfolio
- Using an excel spreadsheet and the calculations you have done above, prepare a spreadsheet that provides the expected returns and the risk for a portfolio that invests in stock A and stock B. Prepare the calculations using 4% increments in the weights. (10 marks)
- Using the excel spreadsheet and the information from part m, create a graph of your results. (If you have followed instructions and done the calculations correctly, your graph should look similar to the graph in Figure 13-5 on page 474 of the 9th edition.) (5 marks)
- You have $10,000 to invest and would like to create a portfolio that has an expected return of 15 percent. How much will you need to invest in stock A and stock B and what is the risk that is associated with this portfolio? (6 marks)
Please use the EXECL table to show.
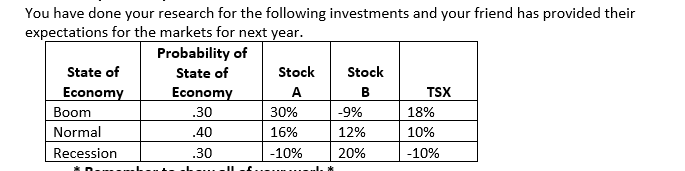
You have done your research for the following investments and your friend has provided their expectations for the markets for next year. Probability of State of State of Stock Stock Economy Economy A TSX Boom 30% -9% 18% Normal .40 16% 12% 10% Recession .30 -10% 20% -10% B .30
Step by Step Solution
There are 3 Steps involved in it
1 Expert Approved Answer
Step: 1 Unlock

Question Has Been Solved by an Expert!
Get step-by-step solutions from verified subject matter experts
Step: 2 Unlock
Step: 3 Unlock