

Question: Using an Excel Spreadsheet, fill out the 3 tables below that corresponds with Part A. Please show all math and equations. Case #2 - Taking
Using an Excel Spreadsheet, fill out the 3 tables below that corresponds with Part A. Please show all math and equations.
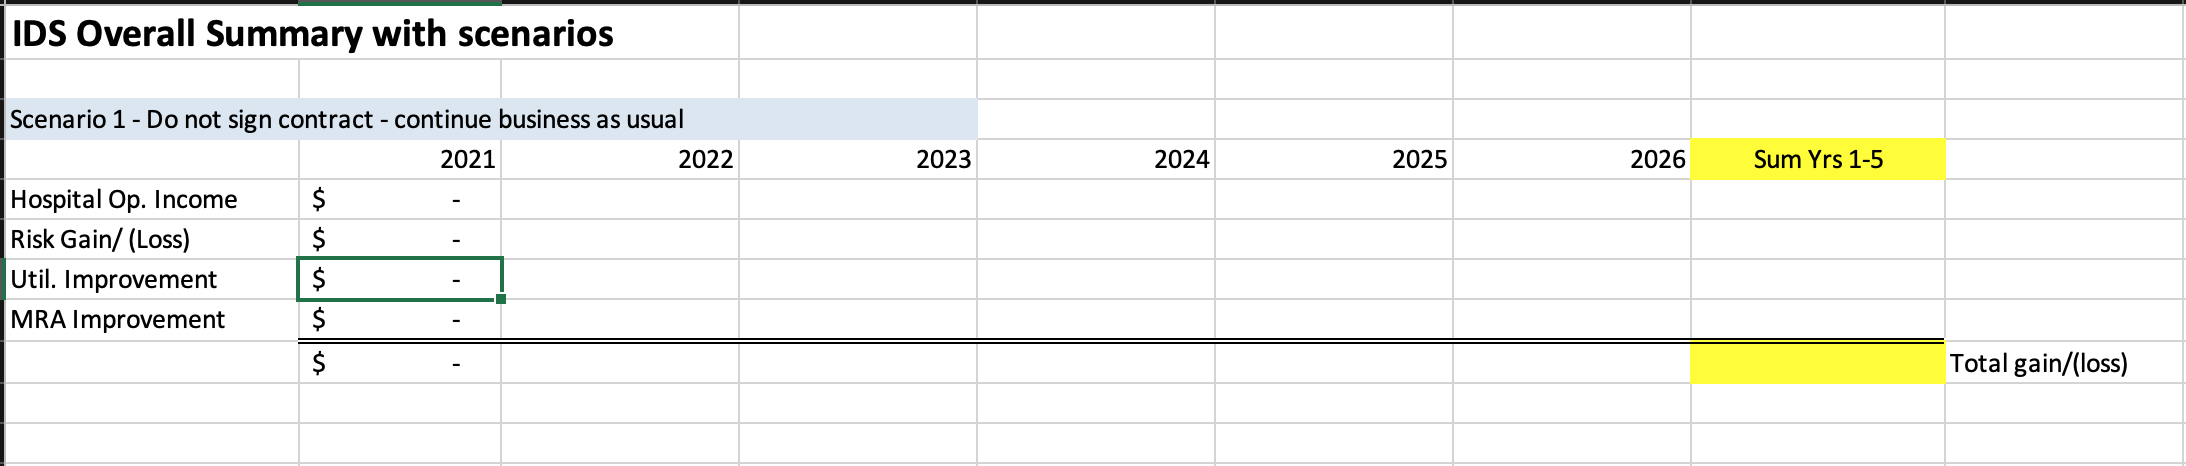
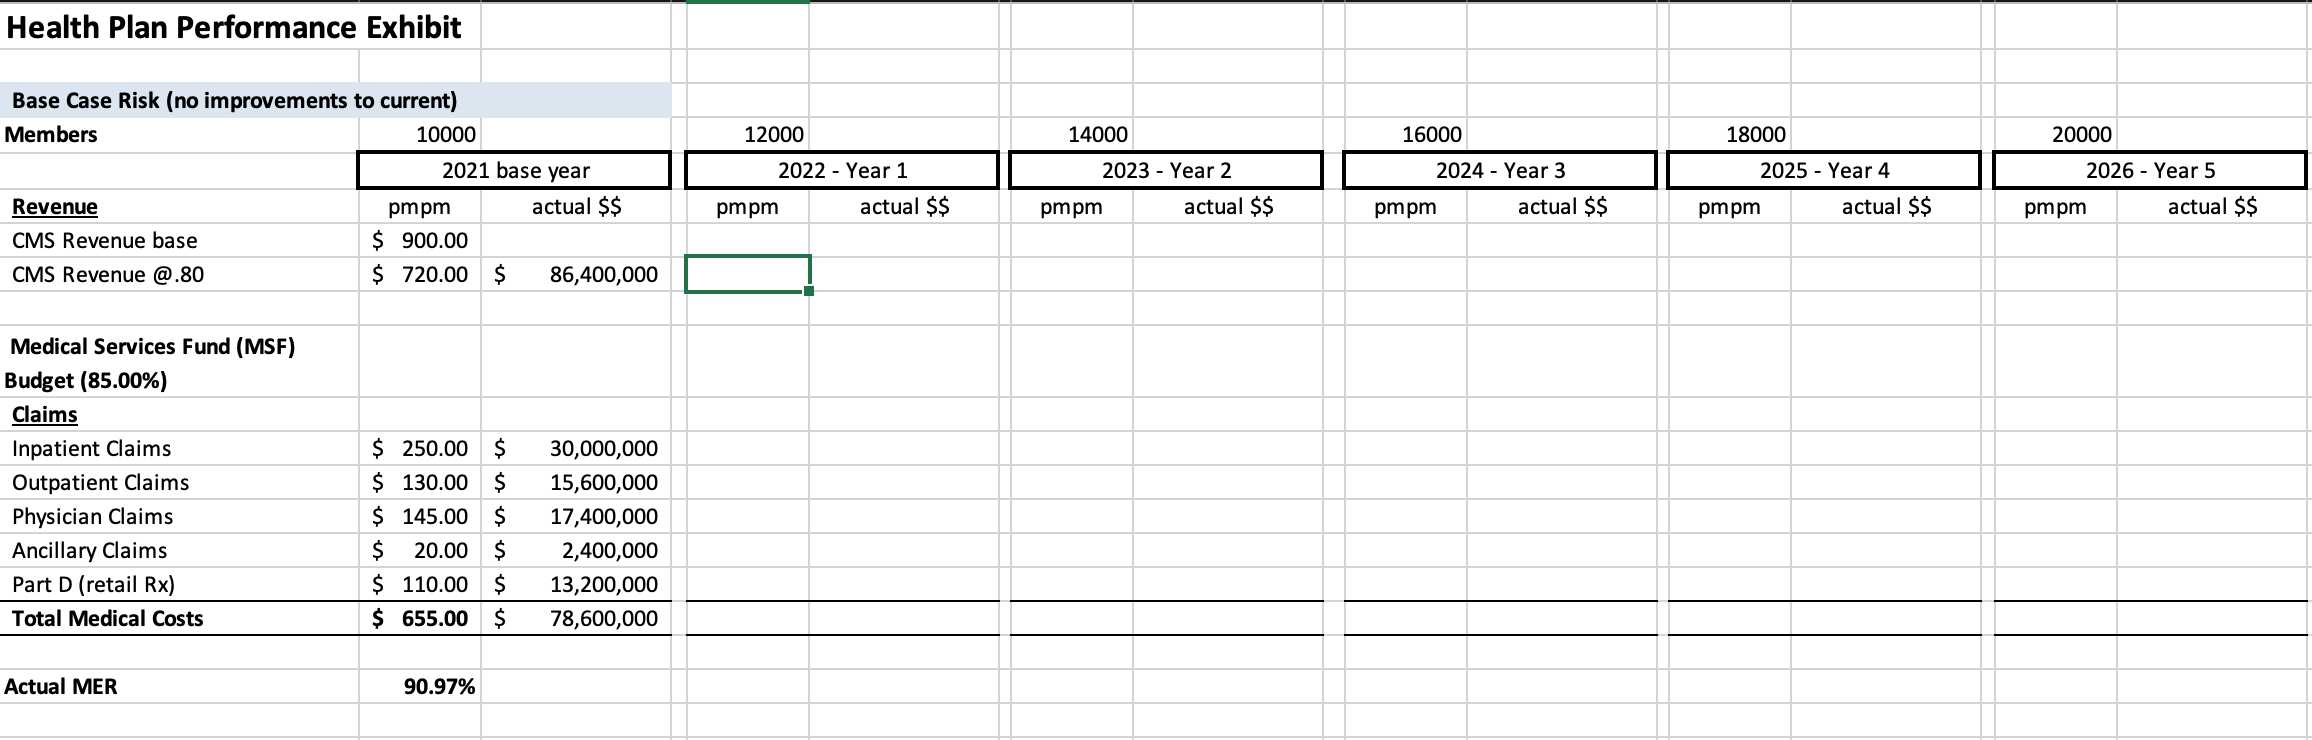
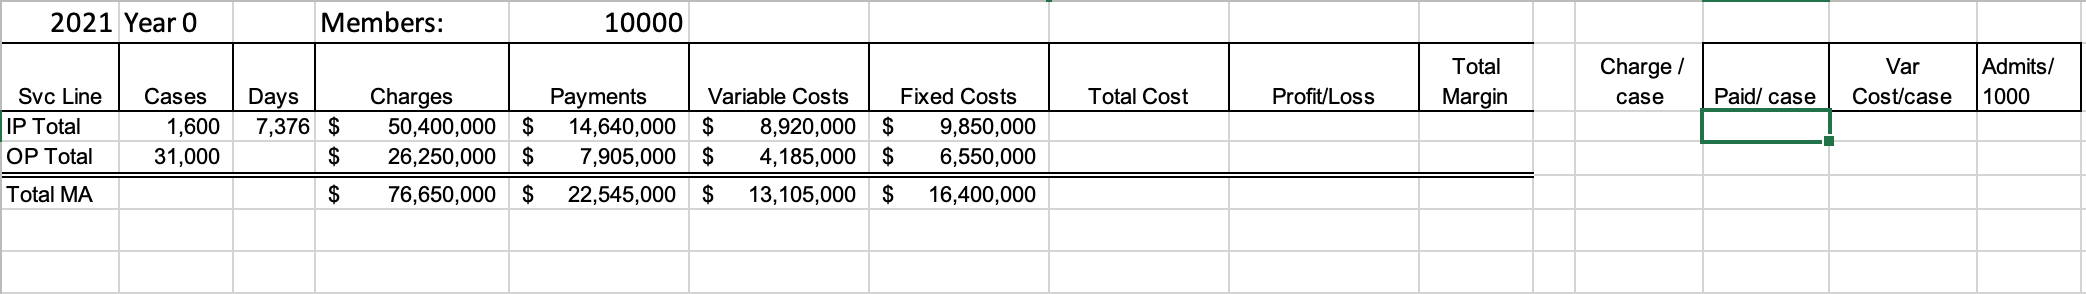
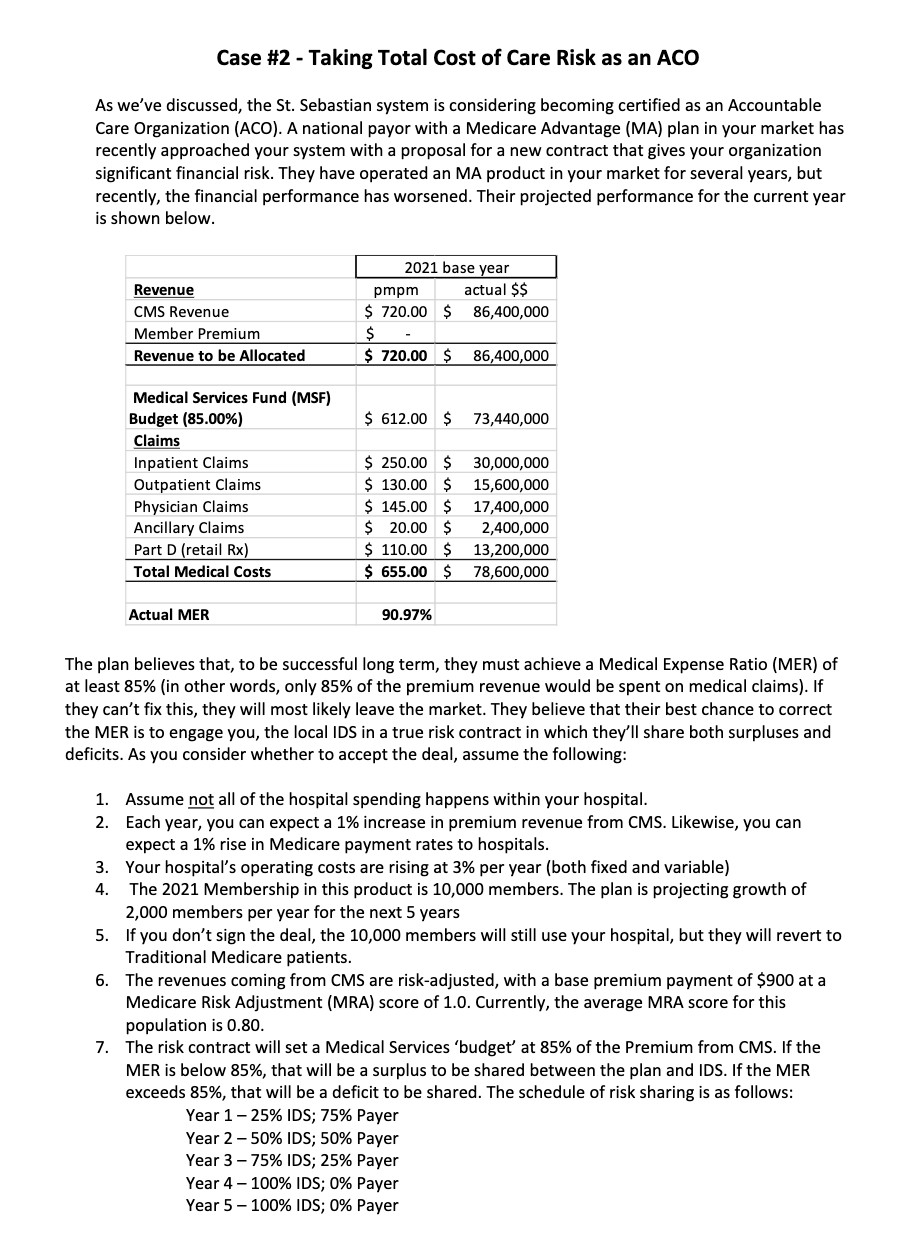
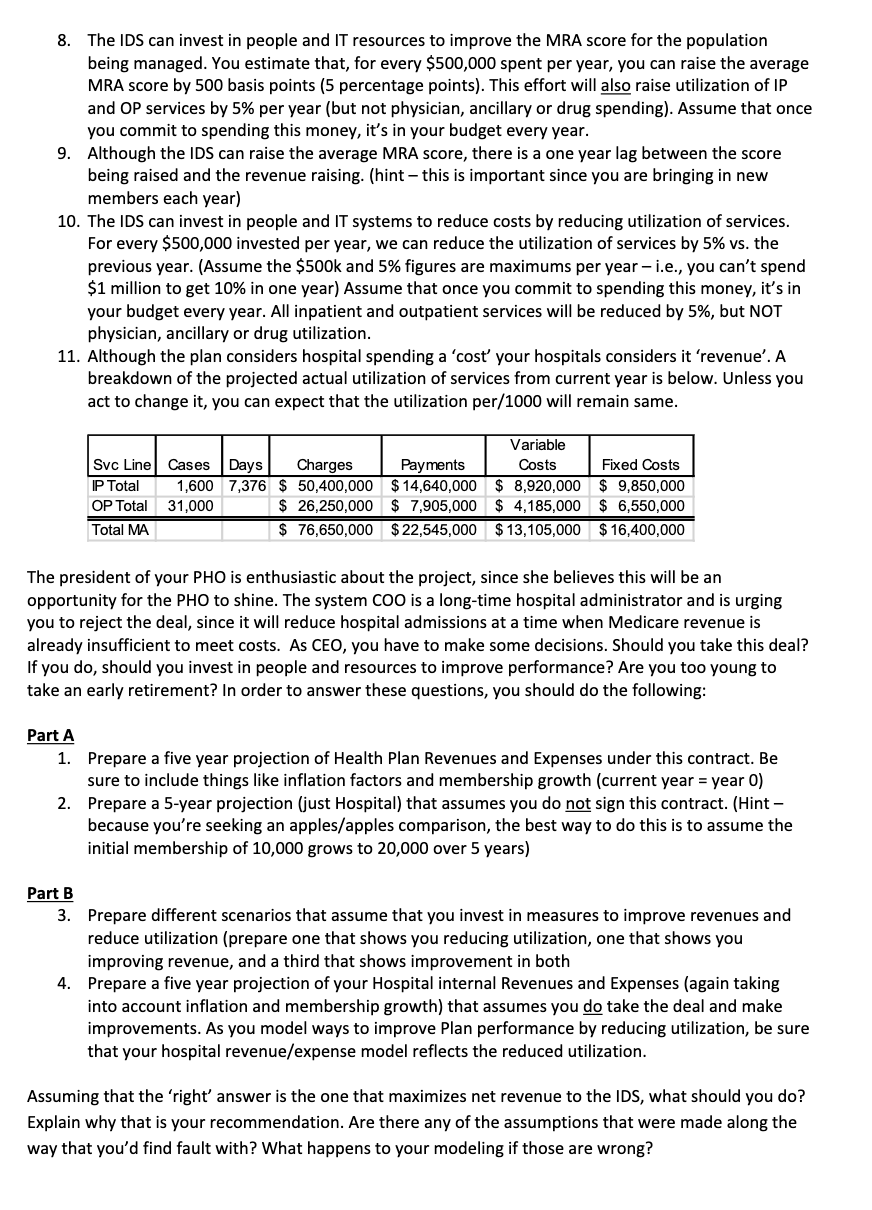
Case #2 - Taking Total Cost of Care Risk as an ACO As we've discussed, the St. Sebastian system is considering becoming certified as an Accountable Care Organization (ACO). A national payor with a Medicare Advantage (MA) plan in your market has recently approached your system with a proposal for a new contract that gives your organization significant financial risk. They have operated an MA product in your market for several years, but recently, the financial performance has worsened. Their projected performance for the current year is shown below. Revenue CMS Revenue Member Premium Revenue to be Allocated 2021 base year pmpm actual $$ $ 720.00 $ 86,400,000 $ $ 720.00 $ 86,400,000 $ 612.00 $ 73,440,000 Medical Services Fund (MSF) Budget (85.00%) Claims Inpatient Claims Outpatient Claims Physician Claims Ancillary Claims Part D (retail Rx) Total Medical Costs $ 250.00 $ $ 130.00 $ $ 145.00 $ $ 20.00 $ $ 110.00 $ $ 655.00 $ 30,000,000 15,600,000 17,400,000 2,400,000 13,200,000 78,600,000 Actual MER 90.97% The plan believes that, to be successful long term, they must achieve a Medical Expense Ratio (MER) of at least 85% (in other words, only 85% of the premium revenue would be spent on medical claims). If they can't fix this, they will most likely leave the market. They believe that their best chance to correct the MER is to engage you, the local IDS in a true risk contract in which they'll share both surpluses and deficits. As you consider whether to accept the deal, assume the following: 1. Assume not all of the hospital spending happens within your hospital. 2. Each year, you can expect a 1% increase in premium revenue from CMS. Likewise, you can expect a 1% rise in Medicare payment rates to hospitals. 3. Your hospital's operating costs are rising at 3% per year (both fixed and variable) 4. The 2021 Membership in this product is 10,000 members. The plan is projecting growth of 2,000 members per year for the next 5 years 5. If you don't sign the deal, the 10,000 members will still use your hospital, but they will revert to Traditional Medicare patients. 6. The revenues coming from CMS are risk-adjusted, with a base premium payment of $900 at a Medicare Risk Adjustment (MRA) score of 1.0. Currently, the average MRA score for this population is 0.80. 7. The risk contract will set a Medical Services 'budget' at 85% of the Premium from CMS. If the MER is below 85%, that will be a surplus to be shared between the plan and IDS. If the MER exceeds 85%, that will be a deficit to be shared. The schedule of risk sharing is as follows: Year 1-25% IDS; 75% Payer Year 2-50% IDS; 50% Payer Year 3 -75% IDS; 25% Payer Year 4 - 100% IDS; 0% Payer Year 5- 100% IDS; 0% Payer 8. The IDS can invest in people and IT resources to improve the MRA score for the population being managed. You estimate that, for every $500,000 spent per year, you can raise the average MRA score by 500 basis points (5 percentage points). This effort will also raise utilization of IP and OP services by 5% per year (but not physician, ancillary or drug spending). Assume that once you commit to spending this money, it's in your budget every year. 9. Although the IDS can raise the average MRA score, there is a one year lag between the score being raised and the revenue raising. (hint - this is important since you are bringing in new members each year) 10. The IDS can invest in people and IT systems to reduce costs by reducing utilization of services. For every $500,000 invested per year, we can reduce the utilization of services by 5% vs. the previous year. (Assume the $500k and 5% figures are maximums per year - i.e., you can't spend $1 million to get 10% in one year) Assume that once you commit to spending this money, it's in your budget every year. All inpatient and outpatient services will be reduced by 5%, but NOT physician, ancillary or drug utilization. 11. Although the plan considers hospital spending a 'cost your hospitals considers it 'revenue'. A breakdown of the projected actual utilization of services from current year is below. Unless you act to change it, you can expect that the utilization per/1000 will remain same. Variable Svc Line Cases Days Charges Payments Costs Fixed Costs P Total 1,600 7,376 $ 50,400,000 $14,640,000 $ 8,920,000 $ 9,850,000 OP Total 31,000 $ 26,250,000 $ 7,905,000 $ 4,185,000 $ 6,550,000 Total MA $ 76,650,000 $ 22,545,000 $13,105,000 $16,400,000 The president of your PHO is enthusiastic about the project, since she believes this will be an opportunity for the PHO to shine. The system COO is a long-time hospital administrator and is urging you to reject the deal, since it will reduce hospital admissions at a time when Medicare revenue is already insufficient to meet costs. As CEO, you have to make some decisions. Should you take this deal? If you do, should you invest in people and resources to improve performance? Are you too young to take an early retirement? In order to answer these questions, you should do the following: Part A 1. Prepare a five year projection of Health Plan Revenues and Expenses under this contract. Be sure to include things like inflation factors and membership growth (current year = year 0) 2. Prepare a 5-year projection (just Hospital) that assumes you do not sign this contract. (Hint - because you're seeking an apples/apples comparison, the best way to do this is to assume the initial membership of 10,000 grows to 20,000 over 5 years) Part B 3. Prepare different scenarios that assume that you invest in measures to improve revenues and reduce utilization (prepare one that shows you reducing utilization, one that shows you improving revenue, and a third that shows improvement in both 4. Prepare a five year projection of your Hospital internal Revenues and Expenses (again taking into account inflation and membership growth) that assumes you do take the deal and make improvements. As you model ways to improve Plan performance by reducing utilization, be sure that your hospital revenue/expense model reflects the reduced utilization. Assuming that the 'right' answer is the one that maximizes net revenue to the IDS, what should you do? Explain why that is your recommendation. Are there any of the assumptions that were made along the way that you'd find fault with? What happens to your modeling if those are wrong? IDS Overall Summary with scenarios 2023 2024 2025 2026 Sum Yrs 1-5 Scenario 1 - Do not sign contract - continue business as usual 2021 2022 Hospital Op. Income $ Risk Gain/ (Loss) $ Util. Improvement $ MRA Improvement $ $ Total gain/(loss) Health Plan Performance Exhibit 12000 14000 16000 18000 20000 2026 - Year 5 Base Case Risk (no improvements to current) Members 10000 2021 base year Revenue pmpm actual $$ CMS Revenue base $ 900.00 CMS Revenue @.80 $ 720.00 $ 86,400,000 2022 - Year 1 pmpm actual $$ 2023 - Year 2 pmpm actual $$ 2024 - Year 3 pmpm actual $$ 2025 - Year 4 pmpm actual $$ pmpm actual $$ Medical Services Fund (MSF) Budget (85.00%) Claims Inpatient Claims Outpatient Claims Physician Claims Ancillary Claims Part D (retail Rx) Total Medical Costs $ 250.00 $ $ 130.00 $ $ 145.00 $ $ 20.00 $ $ 110.00 $ $ 655.00 $ 30,000,000 15,600,000 17,400,000 2,400,000 13,200,000 78,600,000 Actual MER 90.97% 2021 Year O Members: 10000 Total Margin Charge / case Var Cost/case Admits/ 1000 Total Cost Profit/Loss Paid/ case Svc Line IP Total OP Total Cases 1,600 31,000 Days 7,376 $ $ Charges 50,400,000 26,250,000 76,650,000 $ $ Payments Variable Costs Fixed Costs 14,640,000 $ 8,920,000 $ 9,850,000 7,905,000 $ 4,185,000 $ 6,550,000 22,545,000 $ 13,105,000 $ 16,400,000 Total MA $ $ Case #2 - Taking Total Cost of Care Risk as an ACO As we've discussed, the St. Sebastian system is considering becoming certified as an Accountable Care Organization (ACO). A national payor with a Medicare Advantage (MA) plan in your market has recently approached your system with a proposal for a new contract that gives your organization significant financial risk. They have operated an MA product in your market for several years, but recently, the financial performance has worsened. Their projected performance for the current year is shown below. Revenue CMS Revenue Member Premium Revenue to be Allocated 2021 base year pmpm actual $$ $ 720.00 $ 86,400,000 $ $ 720.00 $ 86,400,000 $ 612.00 $ 73,440,000 Medical Services Fund (MSF) Budget (85.00%) Claims Inpatient Claims Outpatient Claims Physician Claims Ancillary Claims Part D (retail Rx) Total Medical Costs $ 250.00 $ $ 130.00 $ $ 145.00 $ $ 20.00 $ $ 110.00 $ $ 655.00 $ 30,000,000 15,600,000 17,400,000 2,400,000 13,200,000 78,600,000 Actual MER 90.97% The plan believes that, to be successful long term, they must achieve a Medical Expense Ratio (MER) of at least 85% (in other words, only 85% of the premium revenue would be spent on medical claims). If they can't fix this, they will most likely leave the market. They believe that their best chance to correct the MER is to engage you, the local IDS in a true risk contract in which they'll share both surpluses and deficits. As you consider whether to accept the deal, assume the following: 1. Assume not all of the hospital spending happens within your hospital. 2. Each year, you can expect a 1% increase in premium revenue from CMS. Likewise, you can expect a 1% rise in Medicare payment rates to hospitals. 3. Your hospital's operating costs are rising at 3% per year (both fixed and variable) 4. The 2021 Membership in this product is 10,000 members. The plan is projecting growth of 2,000 members per year for the next 5 years 5. If you don't sign the deal, the 10,000 members will still use your hospital, but they will revert to Traditional Medicare patients. 6. The revenues coming from CMS are risk-adjusted, with a base premium payment of $900 at a Medicare Risk Adjustment (MRA) score of 1.0. Currently, the average MRA score for this population is 0.80. 7. The risk contract will set a Medical Services 'budget' at 85% of the Premium from CMS. If the MER is below 85%, that will be a surplus to be shared between the plan and IDS. If the MER exceeds 85%, that will be a deficit to be shared. The schedule of risk sharing is as follows: Year 1-25% IDS; 75% Payer Year 2-50% IDS; 50% Payer Year 3 -75% IDS; 25% Payer Year 4 - 100% IDS; 0% Payer Year 5- 100% IDS; 0% Payer 8. The IDS can invest in people and IT resources to improve the MRA score for the population being managed. You estimate that, for every $500,000 spent per year, you can raise the average MRA score by 500 basis points (5 percentage points). This effort will also raise utilization of IP and OP services by 5% per year (but not physician, ancillary or drug spending). Assume that once you commit to spending this money, it's in your budget every year. 9. Although the IDS can raise the average MRA score, there is a one year lag between the score being raised and the revenue raising. (hint - this is important since you are bringing in new members each year) 10. The IDS can invest in people and IT systems to reduce costs by reducing utilization of services. For every $500,000 invested per year, we can reduce the utilization of services by 5% vs. the previous year. (Assume the $500k and 5% figures are maximums per year - i.e., you can't spend $1 million to get 10% in one year) Assume that once you commit to spending this money, it's in your budget every year. All inpatient and outpatient services will be reduced by 5%, but NOT physician, ancillary or drug utilization. 11. Although the plan considers hospital spending a 'cost your hospitals considers it 'revenue'. A breakdown of the projected actual utilization of services from current year is below. Unless you act to change it, you can expect that the utilization per/1000 will remain same. Variable Svc Line Cases Days Charges Payments Costs Fixed Costs P Total 1,600 7,376 $ 50,400,000 $14,640,000 $ 8,920,000 $ 9,850,000 OP Total 31,000 $ 26,250,000 $ 7,905,000 $ 4,185,000 $ 6,550,000 Total MA $ 76,650,000 $ 22,545,000 $13,105,000 $16,400,000 The president of your PHO is enthusiastic about the project, since she believes this will be an opportunity for the PHO to shine. The system COO is a long-time hospital administrator and is urging you to reject the deal, since it will reduce hospital admissions at a time when Medicare revenue is already insufficient to meet costs. As CEO, you have to make some decisions. Should you take this deal? If you do, should you invest in people and resources to improve performance? Are you too young to take an early retirement? In order to answer these questions, you should do the following: Part A 1. Prepare a five year projection of Health Plan Revenues and Expenses under this contract. Be sure to include things like inflation factors and membership growth (current year = year 0) 2. Prepare a 5-year projection (just Hospital) that assumes you do not sign this contract. (Hint - because you're seeking an apples/apples comparison, the best way to do this is to assume the initial membership of 10,000 grows to 20,000 over 5 years) Part B 3. Prepare different scenarios that assume that you invest in measures to improve revenues and reduce utilization (prepare one that shows you reducing utilization, one that shows you improving revenue, and a third that shows improvement in both 4. Prepare a five year projection of your Hospital internal Revenues and Expenses (again taking into account inflation and membership growth) that assumes you do take the deal and make improvements. As you model ways to improve Plan performance by reducing utilization, be sure that your hospital revenue/expense model reflects the reduced utilization. Assuming that the 'right' answer is the one that maximizes net revenue to the IDS, what should you do? Explain why that is your recommendation. Are there any of the assumptions that were made along the way that you'd find fault with? What happens to your modeling if those are wrong? IDS Overall Summary with scenarios 2023 2024 2025 2026 Sum Yrs 1-5 Scenario 1 - Do not sign contract - continue business as usual 2021 2022 Hospital Op. Income $ Risk Gain/ (Loss) $ Util. Improvement $ MRA Improvement $ $ Total gain/(loss) Health Plan Performance Exhibit 12000 14000 16000 18000 20000 2026 - Year 5 Base Case Risk (no improvements to current) Members 10000 2021 base year Revenue pmpm actual $$ CMS Revenue base $ 900.00 CMS Revenue @.80 $ 720.00 $ 86,400,000 2022 - Year 1 pmpm actual $$ 2023 - Year 2 pmpm actual $$ 2024 - Year 3 pmpm actual $$ 2025 - Year 4 pmpm actual $$ pmpm actual $$ Medical Services Fund (MSF) Budget (85.00%) Claims Inpatient Claims Outpatient Claims Physician Claims Ancillary Claims Part D (retail Rx) Total Medical Costs $ 250.00 $ $ 130.00 $ $ 145.00 $ $ 20.00 $ $ 110.00 $ $ 655.00 $ 30,000,000 15,600,000 17,400,000 2,400,000 13,200,000 78,600,000 Actual MER 90.97% 2021 Year O Members: 10000 Total Margin Charge / case Var Cost/case Admits/ 1000 Total Cost Profit/Loss Paid/ case Svc Line IP Total OP Total Cases 1,600 31,000 Days 7,376 $ $ Charges 50,400,000 26,250,000 76,650,000 $ $ Payments Variable Costs Fixed Costs 14,640,000 $ 8,920,000 $ 9,850,000 7,905,000 $ 4,185,000 $ 6,550,000 22,545,000 $ 13,105,000 $ 16,400,000 Total MA $ $
Step by Step Solution
There are 3 Steps involved in it

Get step-by-step solutions from verified subject matter experts