

Question: using an excel table using the 12 data available find the following sample statistics (Mean, Standard deviation, Variance, Median, Max, Min, Range , Q1, Q2,
using an excel table using the 12 data available find the following sample statistics (Mean, Standard deviation, Variance, Median, Max, Min, Range , Q1, Q2, Q3)
Jan ) 250.8
Feb-) 188.4
March ) 190.4
April ) 192.6
May) 220
June ) 186.4
July) 192.8
August) 190.8
Sept) 190
Oct) 188.6
Nov) 190.4
Dec) 193.6
***please values should be done on an excel sheet.. an example is attached as a picture to help the writer
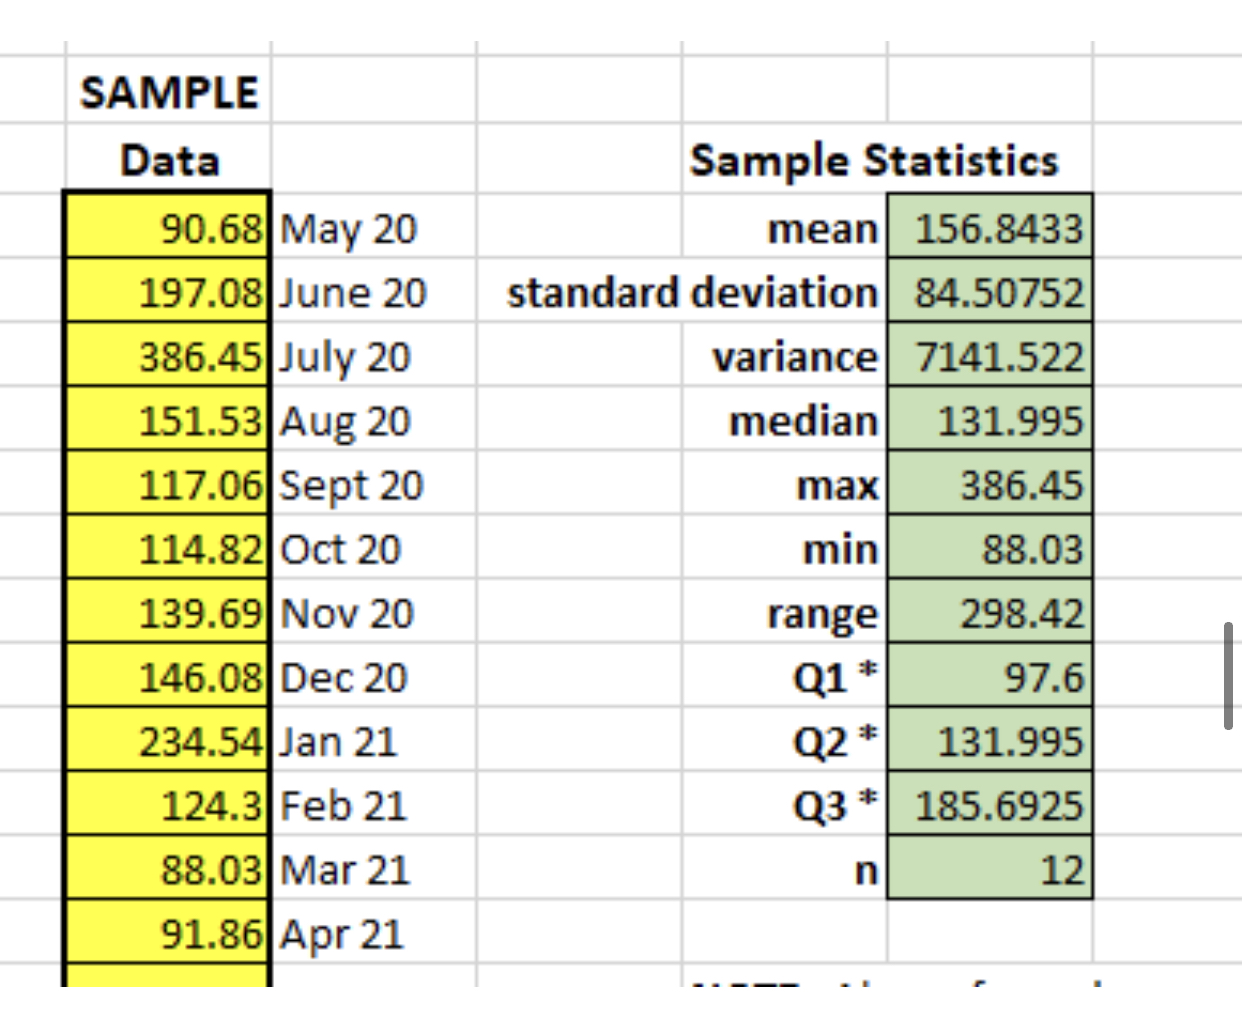
SAMPLE Data Sample Statistics 90.68 May 20 mean 156.8433 197.08 June 20 standard deviation 84.50752 386.45 July 20 variance 7141.522 151.53 Aug 20 median 131.995 117.06 Sept 20 max 386.45 114.82 Oct 20 min 88.03 139.69 Nov 20 range 298.42 146.08 Dec 20 Q1 * 97.6 234.54 Jan 21 Q2* 131.995 124.3 Feb 21 Q3 * 185.6925 88.03 Mar 21 n 12 91.86 Apr 21
Step by Step Solution
There are 3 Steps involved in it

Get step-by-step solutions from verified subject matter experts