

Question: Using Apple 2020 K-10 Report For your assignment, locate and review the last 3 years of the annual report of the company selected for your
Using Apple 2020 K-10 Report
For your assignment, locate and review the last 3 years of the annual report of the company selected for your Financial Statement Analysis Report. This document is located on the company's website under Investor Relations. Prepare a vertical and horizontal analysis in the Balance Sheet and Income Statement tabs of the "Financial Statement Report Excel Spreadsheet" (FSAR Excel Spreadsheet) provided. The spreadsheet will serve as a guideline for completing the assignment, the actual sections or order of reporting from the company's annual report may vary. Complete only the applicable sections based on the information provided in the company's annual report.
- Complete the horizontal analysis column of the prior 3
- Complete the vertical analysis column for the prior 3
Address in the following questions in the comments section of both the Balance Sheet and Income Statement tabs:
- What accounts changed for the period and how did this affect the financial analysis calculation?
- Why did the account change during the period? Explain what business decisions may have caused the change.
- How does this change influence the company's performance?
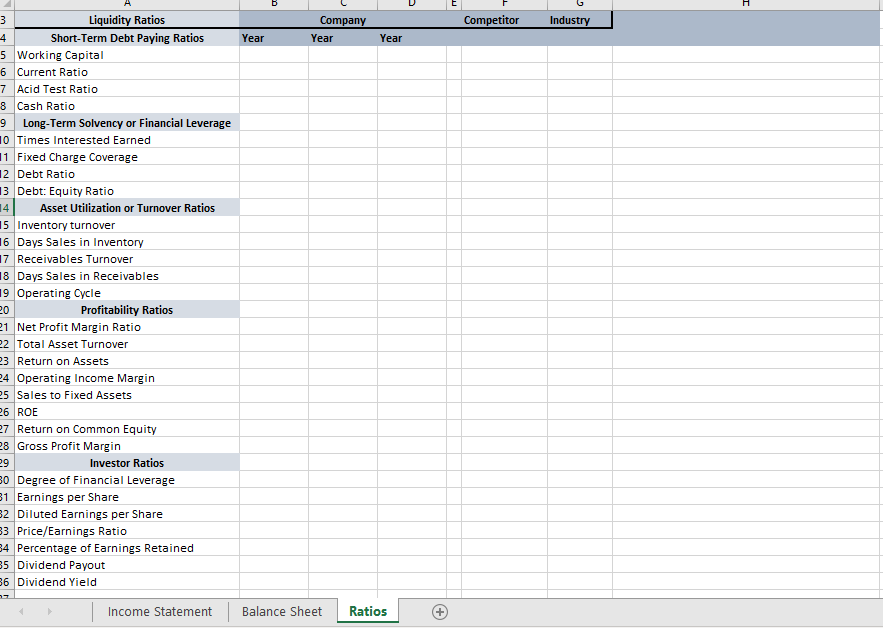
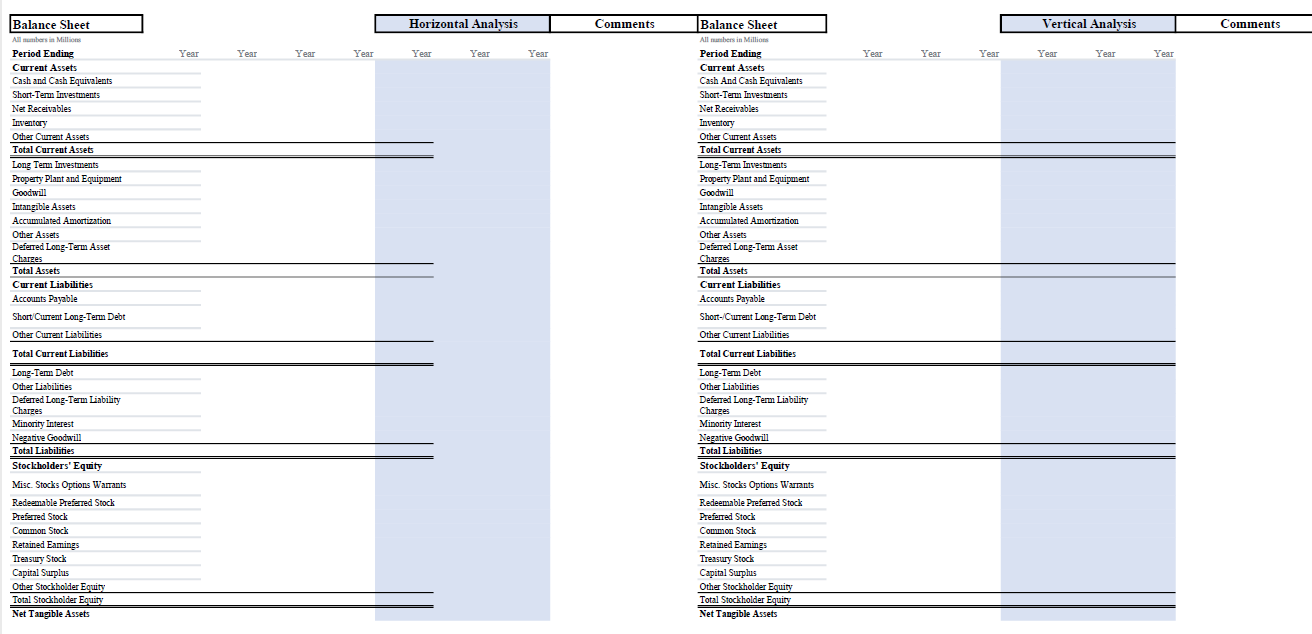
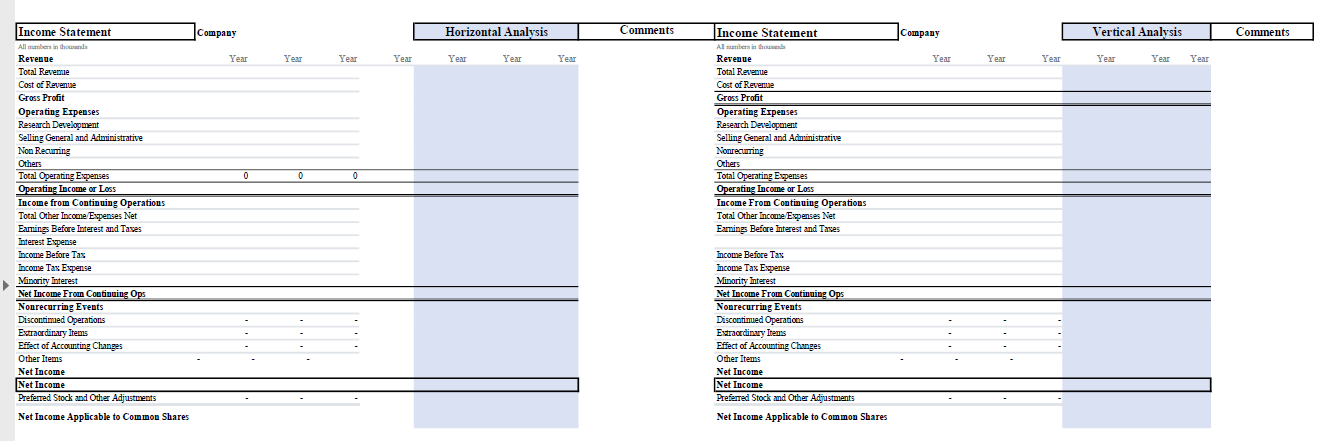
H Competitor Industry Company Year 4 Year Year 3 Liquidity Ratios Short-Term Debt Paying Ratios 5 Working Capital 6 Current Ratio 7 Acid Test Ratio 8 Cash Ratio 9 Long-Term Solvency or Financial Leverage 10 Times Interested Earned 11 Fixed Charge Coverage 12 Debt Ratio 13 Debt: Equity Ratio 14 Asset Utilization or Turnover Ratios 15 Inventory turnover 16 Days Sales in Inventory 17 Receivables Turnover 18 Days Sales in Receivables 19 Operating Cycle 20 Profitability Ratios 21 Net Profit Margin Ratio 22 Total Asset Turnover 3 Return on Assets 24 Operating Income Margin 25 Sales to Fixed Assets 26 ROE 27 Return on Common Equity 28 Gross Profit Margin 29 Investor Ratios 30 Degree of Financial Leverage 81 Earnings per Share 2 Diluted Earnings per Share 3 Price/Earnings Ratio 84 Percentage of Earnings Retained 35 Dividend Payout 36 Dividend Yield Income Statement Balance Sheet Ratios Horizontal Analysis Coinments Vertical Analysis Cominents Year Year Year Year Year Year Year Year Year Year Year Year Year Balance Sheet Alumbers in Million Period Ending Current Assets Cash and Cash Equivalents Short-Term Investments Net Receivables Triventary Other Current Assets Total Current Assets Long Term Investments Property Plant and Equipment Goodwill Intangible Assets Accumulated Amortization Other Assets Deferred Long-Term Asset Charges Total Assets Current Liabilities Accounts Payable Short Current Long-Term Debt Other Current Liabilities Total Current Liabilities Long-Term Debt Other Liabilities Deferred Long-Term Liability Charges Minority Interest Negative Goodwill Total Liabilities Stockholders' Equity Misc. Stocks Options Warrants Redeemable Preferred Stock Preferred Stock Common Stock Retained Eamings Treasury Stock Capital Surplus Other Stockholder Equity Total Stockholder Equity Net Tangible Assets Balance Sheet All aber in Million Period Ending Current Assets Cash And Cash Equivalents Short-Term Investments - Net Receivables Inventory Other Curent Assets Total Current Assets Long-Term Investments Property Plant and Equipment Goodwill Intangible Assets Accumulated Amortization Other Assets Deferred Long-Term Asset Charges Total Assets Current Liabilities Accounts Payable Short-Current Long-Term Debt Other Current Liabilities Total Current Liabilities Long-Term Debt Other Liabilities Deferred Long-Term Liability Charges Minority Interest Negative Goodwill Total Liabilities Stockholders' Equity Misc. Stocks Options Warrants Redeemable Preferred Stock Preferred Stock Common Stock Retained Earnings Treasury Stock Capital Surplus Other Stockholder Equity Total Stockholder Equity Net Tangible Assets Horizontal Analysis Comments Company Vertical Analysis Comments Year Year Year Year Year Year Year Year Year Year Year Year Income Statement Alsters in die the Revenue Total Revenue Cost of Revente Gross Profit Operating Expenses Research Development Selling General and Adurinistrative Nonrecurring Others Total Operating Expenses Operating Income or Loss Income From Continuing Operations Total Other Income Expenses Net Earnings Before Interest and Taxes 0 Income Statement Company All numbers in this Revenue Year Total Revenue Cost of Revenue Gross Profit Operating Expenses Research Development Selling General and Administrative Non Recurring Others Total Operating Expenses 0 Operating Income or Loss Income from Continuing Operations Total Other Income Expenses Net Earings Before Interest and Taxes Interest Expense Income Before Tas Income Tax Expense Minority Interest Net Income From Continuing Ops Nonrecurring Events Discontinued Operations Extraordinary Items Effect of Accounting Changes Other Items Net Income Net Income Preferred Stock and Other Adjustments Net Income Applicable to Common Shares 0 Income Before Tax Income Tax Expense Minority Interest Net Income From Continuing Ops Nonrecurring Events Discontinued Operations Extraordinary Items Effect of Accounting Changes Other Items Net Income Net Income Preferred Stock and Other Adjustments Net Income Applicable to Common Shares H Competitor Industry Company Year 4 Year Year 3 Liquidity Ratios Short-Term Debt Paying Ratios 5 Working Capital 6 Current Ratio 7 Acid Test Ratio 8 Cash Ratio 9 Long-Term Solvency or Financial Leverage 10 Times Interested Earned 11 Fixed Charge Coverage 12 Debt Ratio 13 Debt: Equity Ratio 14 Asset Utilization or Turnover Ratios 15 Inventory turnover 16 Days Sales in Inventory 17 Receivables Turnover 18 Days Sales in Receivables 19 Operating Cycle 20 Profitability Ratios 21 Net Profit Margin Ratio 22 Total Asset Turnover 3 Return on Assets 24 Operating Income Margin 25 Sales to Fixed Assets 26 ROE 27 Return on Common Equity 28 Gross Profit Margin 29 Investor Ratios 30 Degree of Financial Leverage 81 Earnings per Share 2 Diluted Earnings per Share 3 Price/Earnings Ratio 84 Percentage of Earnings Retained 35 Dividend Payout 36 Dividend Yield Income Statement Balance Sheet Ratios Horizontal Analysis Coinments Vertical Analysis Cominents Year Year Year Year Year Year Year Year Year Year Year Year Year Balance Sheet Alumbers in Million Period Ending Current Assets Cash and Cash Equivalents Short-Term Investments Net Receivables Triventary Other Current Assets Total Current Assets Long Term Investments Property Plant and Equipment Goodwill Intangible Assets Accumulated Amortization Other Assets Deferred Long-Term Asset Charges Total Assets Current Liabilities Accounts Payable Short Current Long-Term Debt Other Current Liabilities Total Current Liabilities Long-Term Debt Other Liabilities Deferred Long-Term Liability Charges Minority Interest Negative Goodwill Total Liabilities Stockholders' Equity Misc. Stocks Options Warrants Redeemable Preferred Stock Preferred Stock Common Stock Retained Eamings Treasury Stock Capital Surplus Other Stockholder Equity Total Stockholder Equity Net Tangible Assets Balance Sheet All aber in Million Period Ending Current Assets Cash And Cash Equivalents Short-Term Investments - Net Receivables Inventory Other Curent Assets Total Current Assets Long-Term Investments Property Plant and Equipment Goodwill Intangible Assets Accumulated Amortization Other Assets Deferred Long-Term Asset Charges Total Assets Current Liabilities Accounts Payable Short-Current Long-Term Debt Other Current Liabilities Total Current Liabilities Long-Term Debt Other Liabilities Deferred Long-Term Liability Charges Minority Interest Negative Goodwill Total Liabilities Stockholders' Equity Misc. Stocks Options Warrants Redeemable Preferred Stock Preferred Stock Common Stock Retained Earnings Treasury Stock Capital Surplus Other Stockholder Equity Total Stockholder Equity Net Tangible Assets Horizontal Analysis Comments Company Vertical Analysis Comments Year Year Year Year Year Year Year Year Year Year Year Year Income Statement Alsters in die the Revenue Total Revenue Cost of Revente Gross Profit Operating Expenses Research Development Selling General and Adurinistrative Nonrecurring Others Total Operating Expenses Operating Income or Loss Income From Continuing Operations Total Other Income Expenses Net Earnings Before Interest and Taxes 0 Income Statement Company All numbers in this Revenue Year Total Revenue Cost of Revenue Gross Profit Operating Expenses Research Development Selling General and Administrative Non Recurring Others Total Operating Expenses 0 Operating Income or Loss Income from Continuing Operations Total Other Income Expenses Net Earings Before Interest and Taxes Interest Expense Income Before Tas Income Tax Expense Minority Interest Net Income From Continuing Ops Nonrecurring Events Discontinued Operations Extraordinary Items Effect of Accounting Changes Other Items Net Income Net Income Preferred Stock and Other Adjustments Net Income Applicable to Common Shares 0 Income Before Tax Income Tax Expense Minority Interest Net Income From Continuing Ops Nonrecurring Events Discontinued Operations Extraordinary Items Effect of Accounting Changes Other Items Net Income Net Income Preferred Stock and Other Adjustments Net Income Applicable to Common Shares
Step by Step Solution
There are 3 Steps involved in it

Get step-by-step solutions from verified subject matter experts