Question: Using Apple's financial statement information Download Apple's financial statement information, write one-page memo to the management team responding to the question below: Using current assets
Using Apple's financial statement information Download Apple's financial statement information, write one-page memo to the management team responding to the question below:
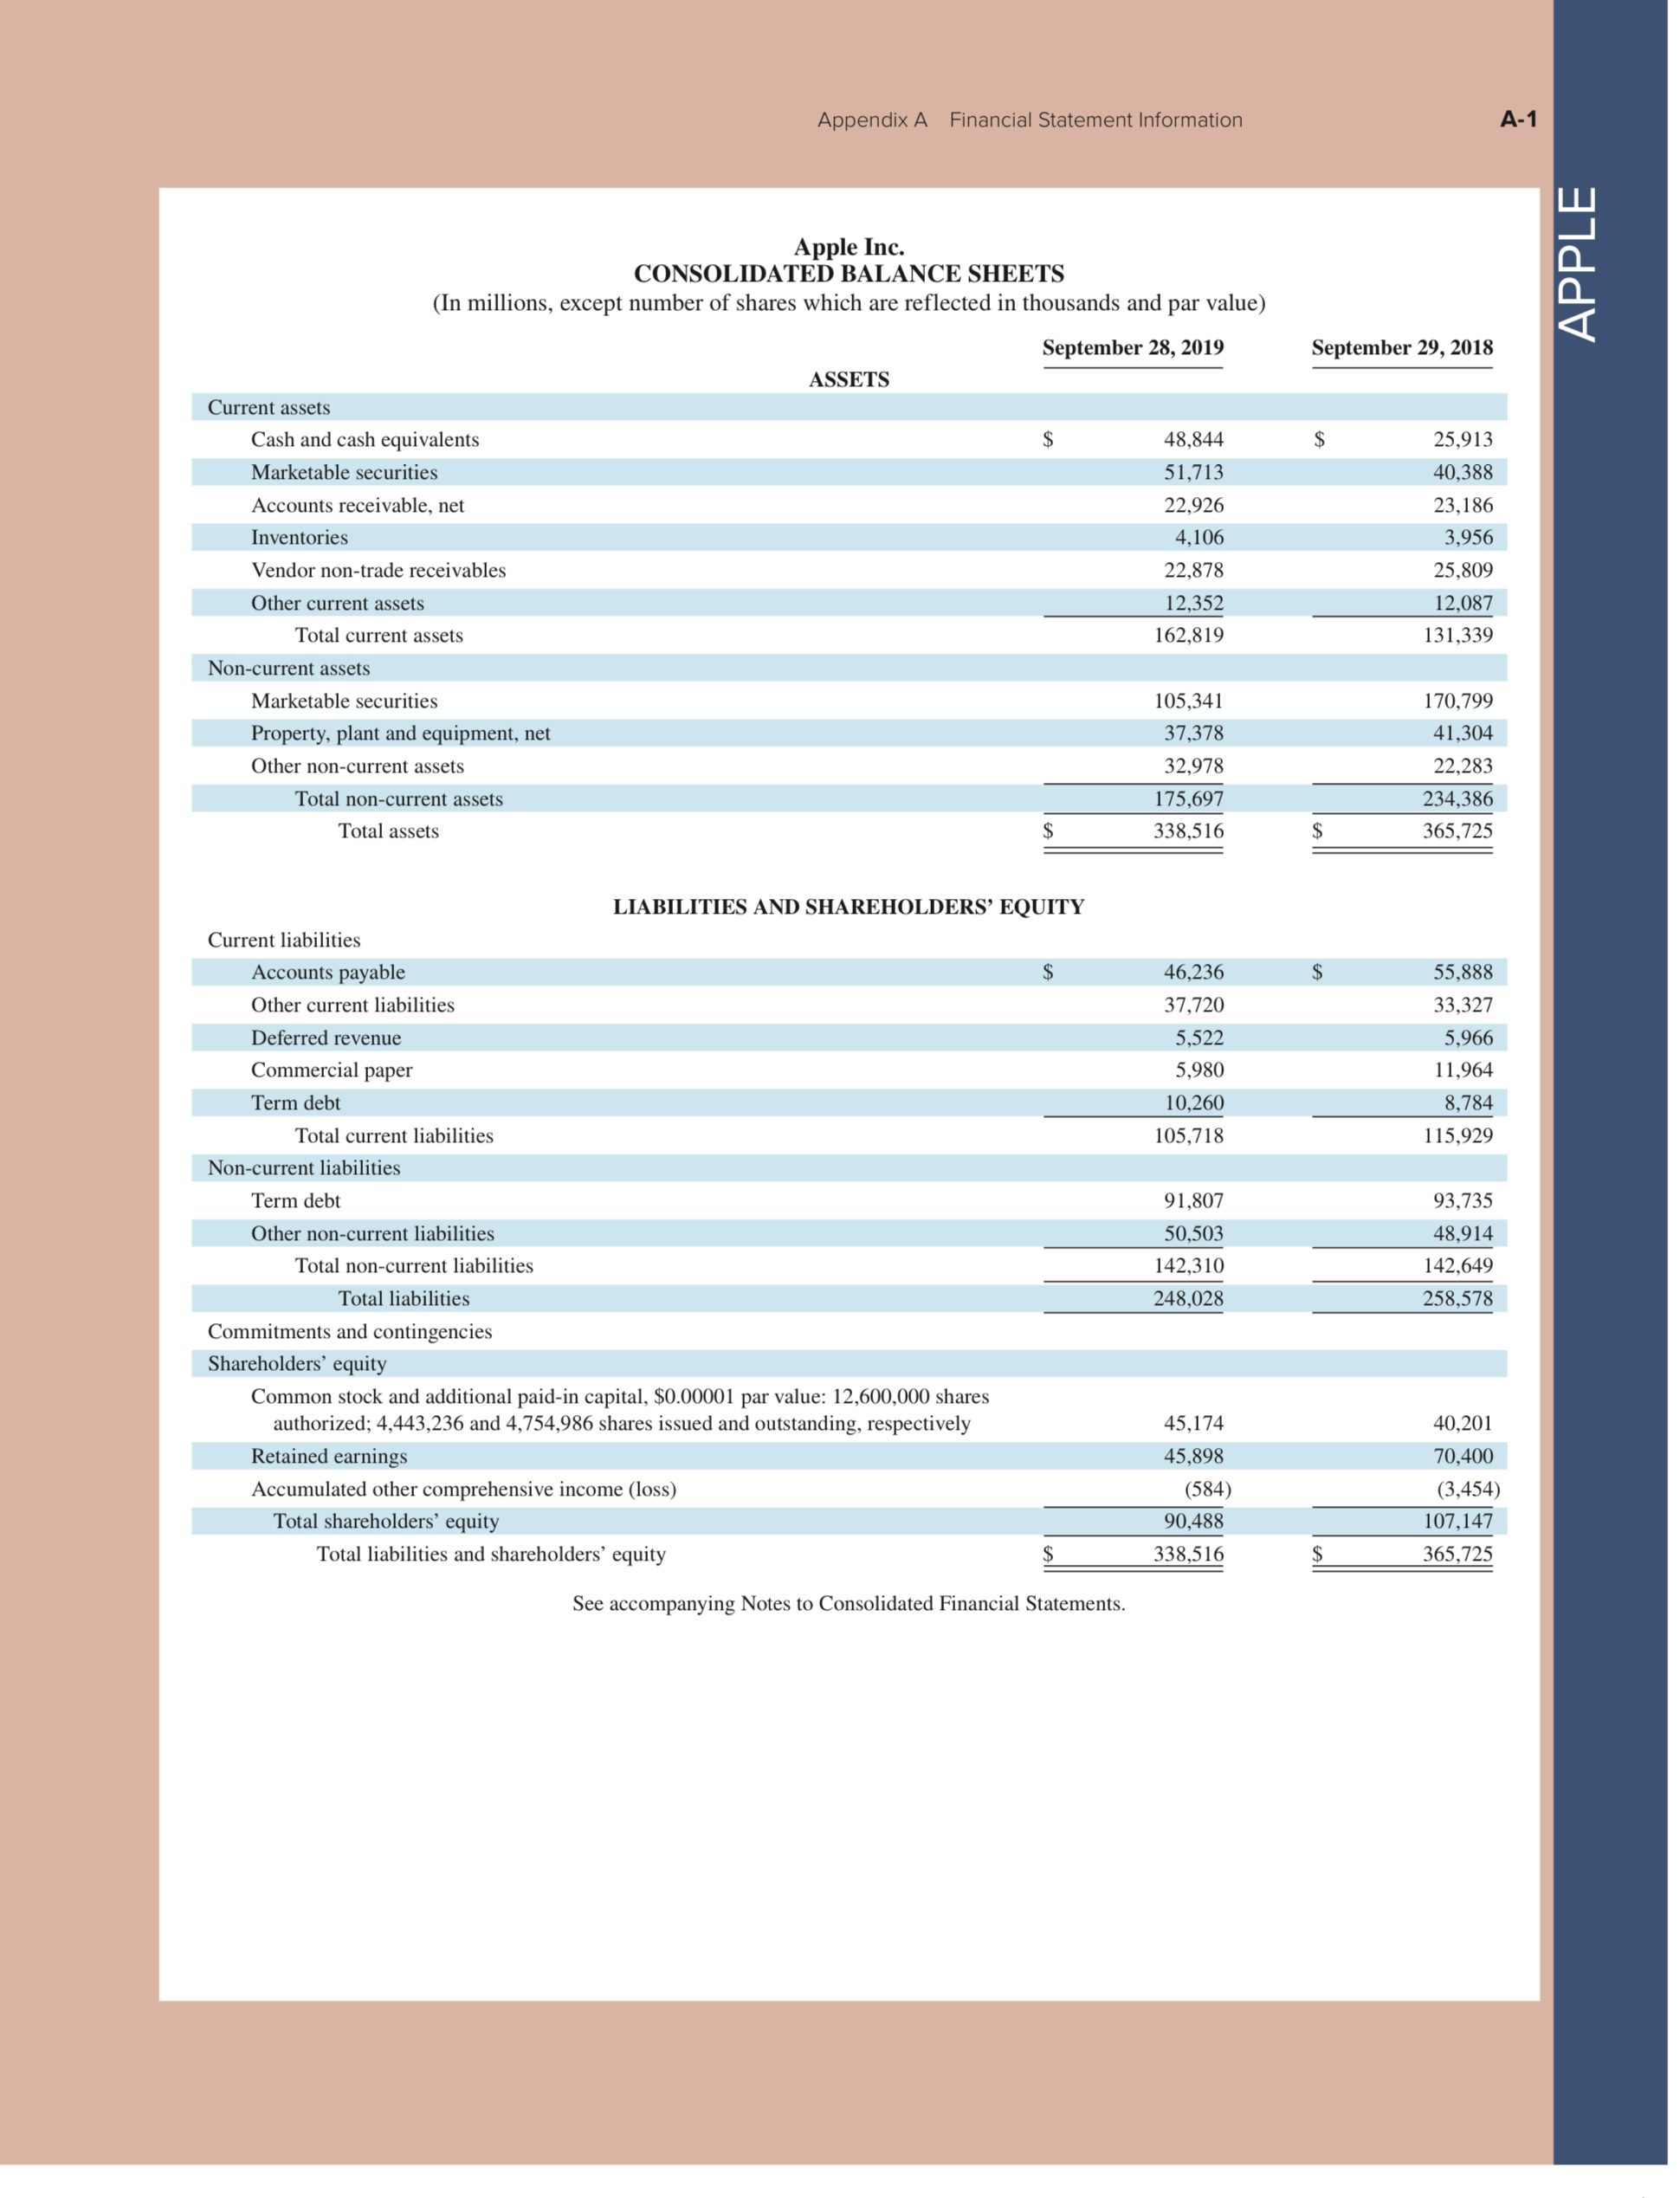
Using current assets as a percent of total assets to measure liquidity, did Apple's asset makeup become more liquid or less liquid in 2019? Explain your answer.
Include a brief overview of the ratio - current assets as a percent of total assets and its purpose.
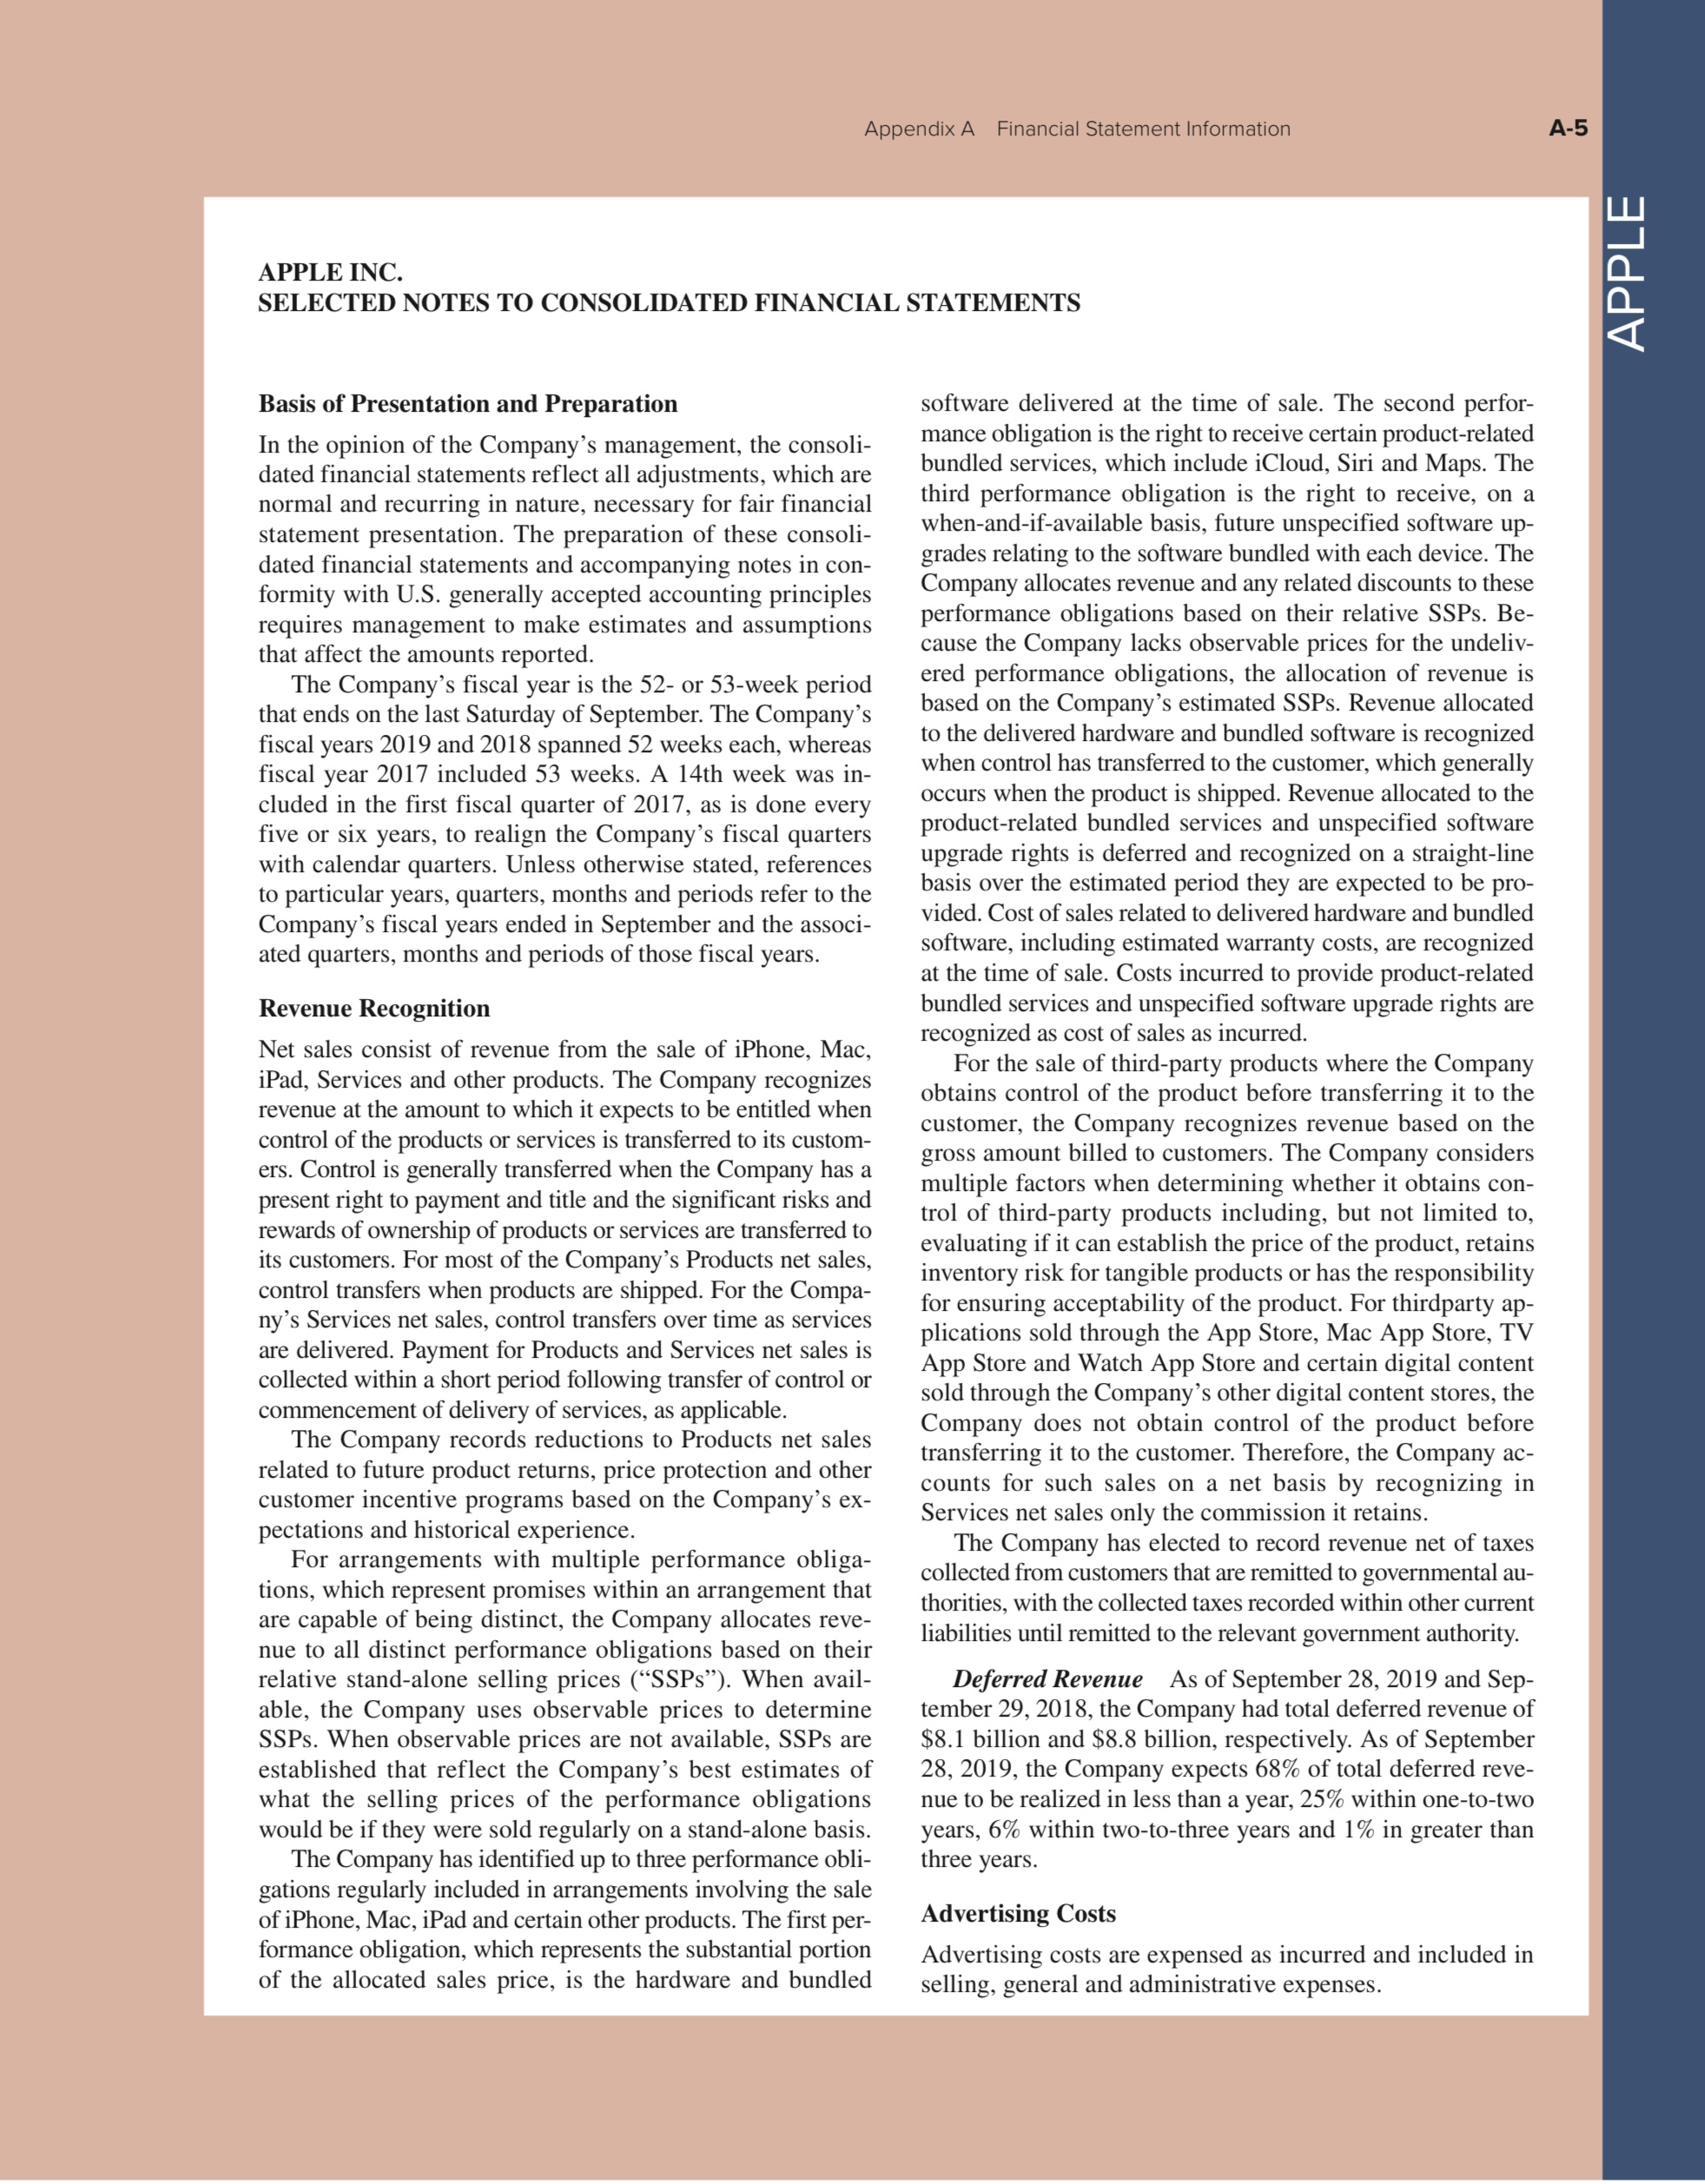
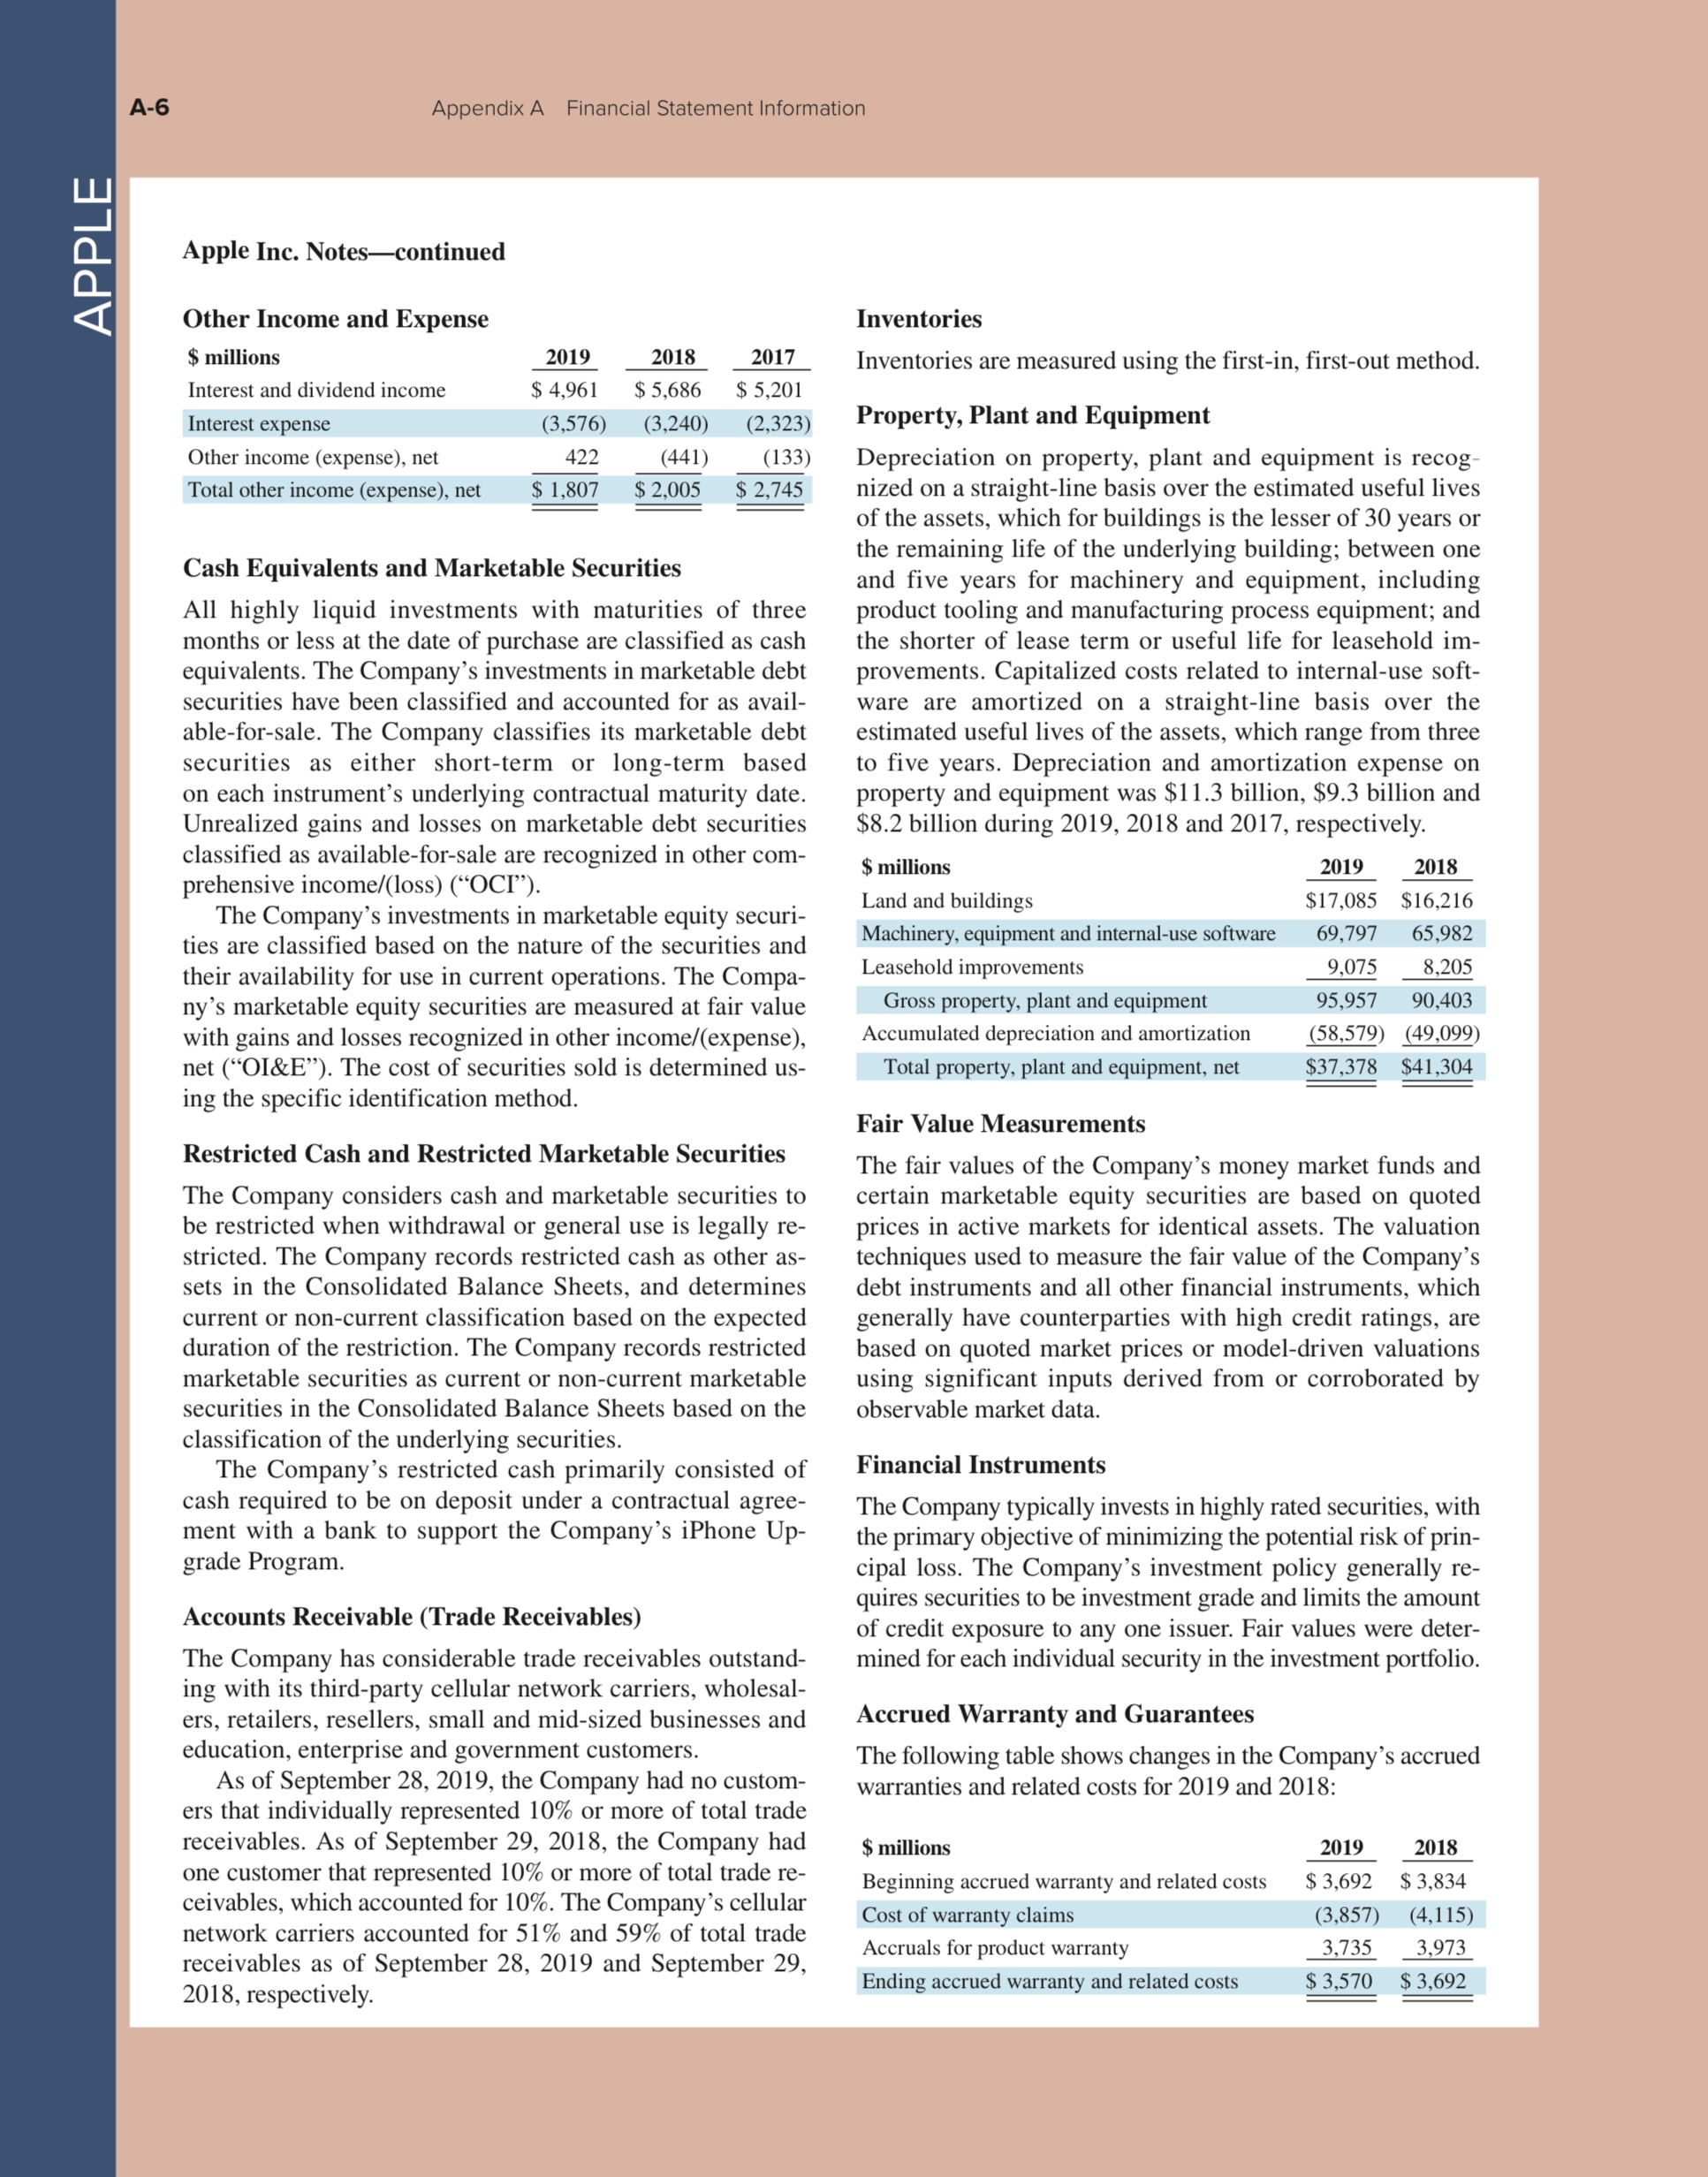
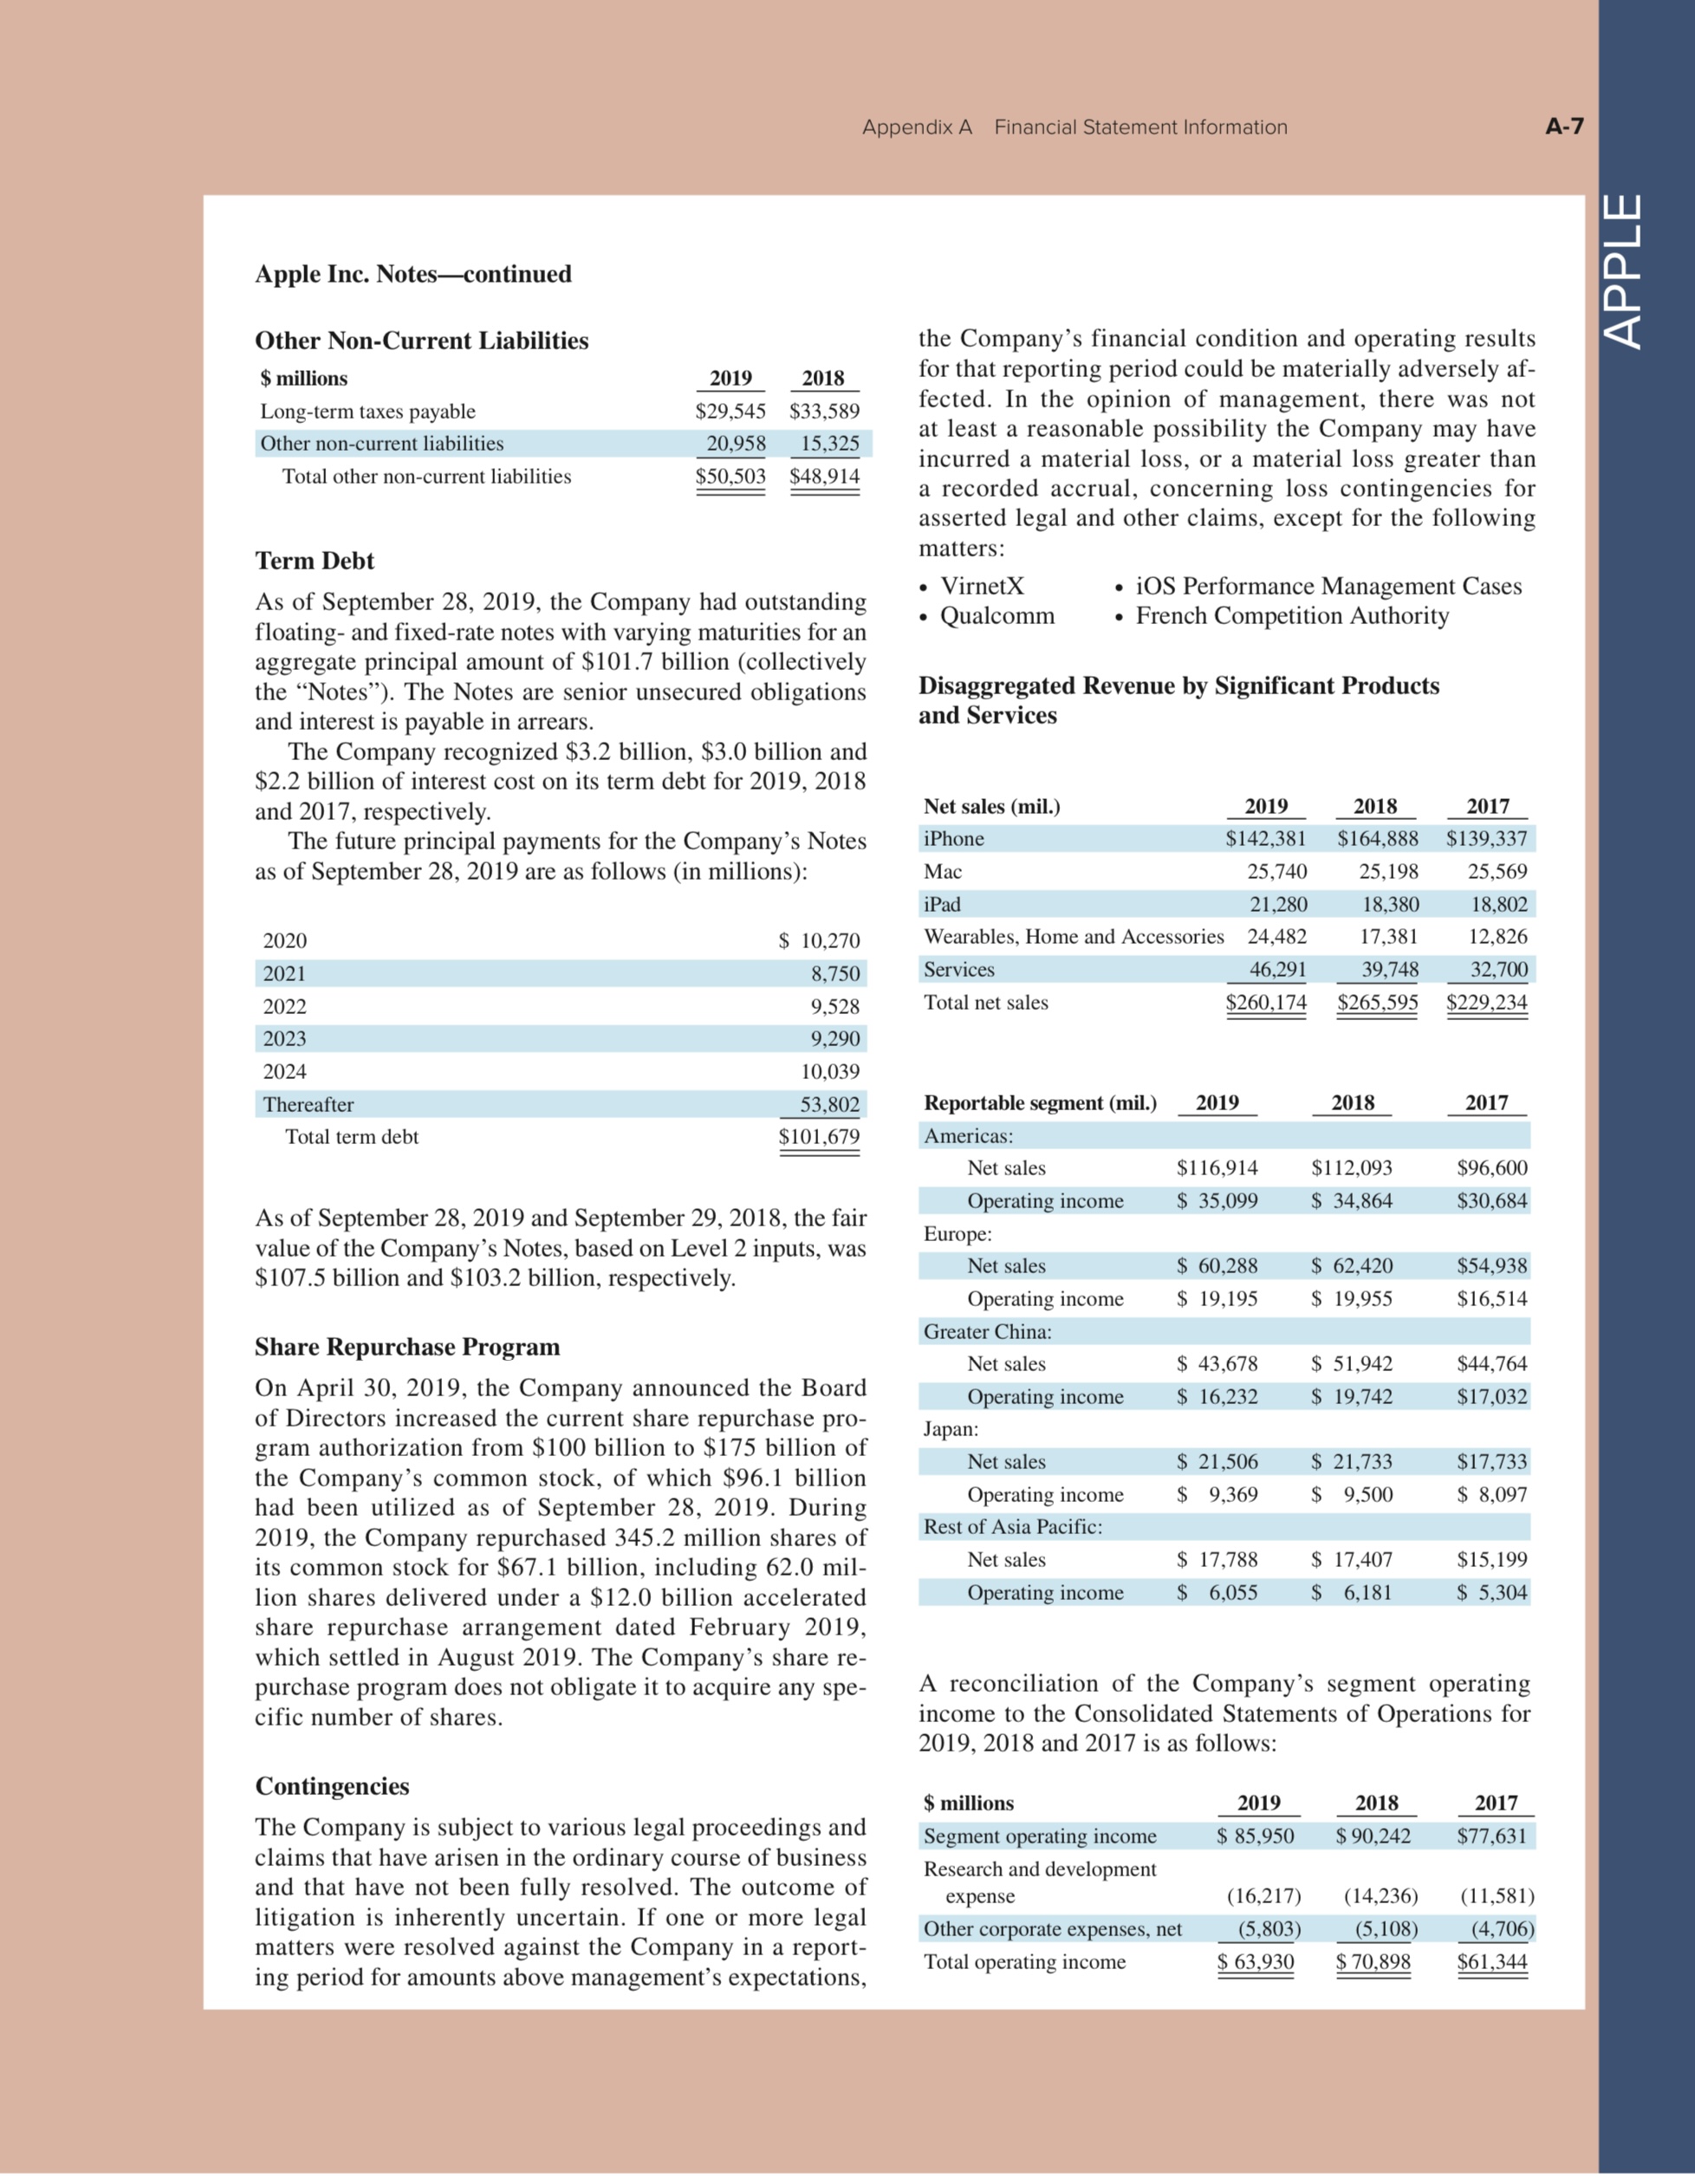
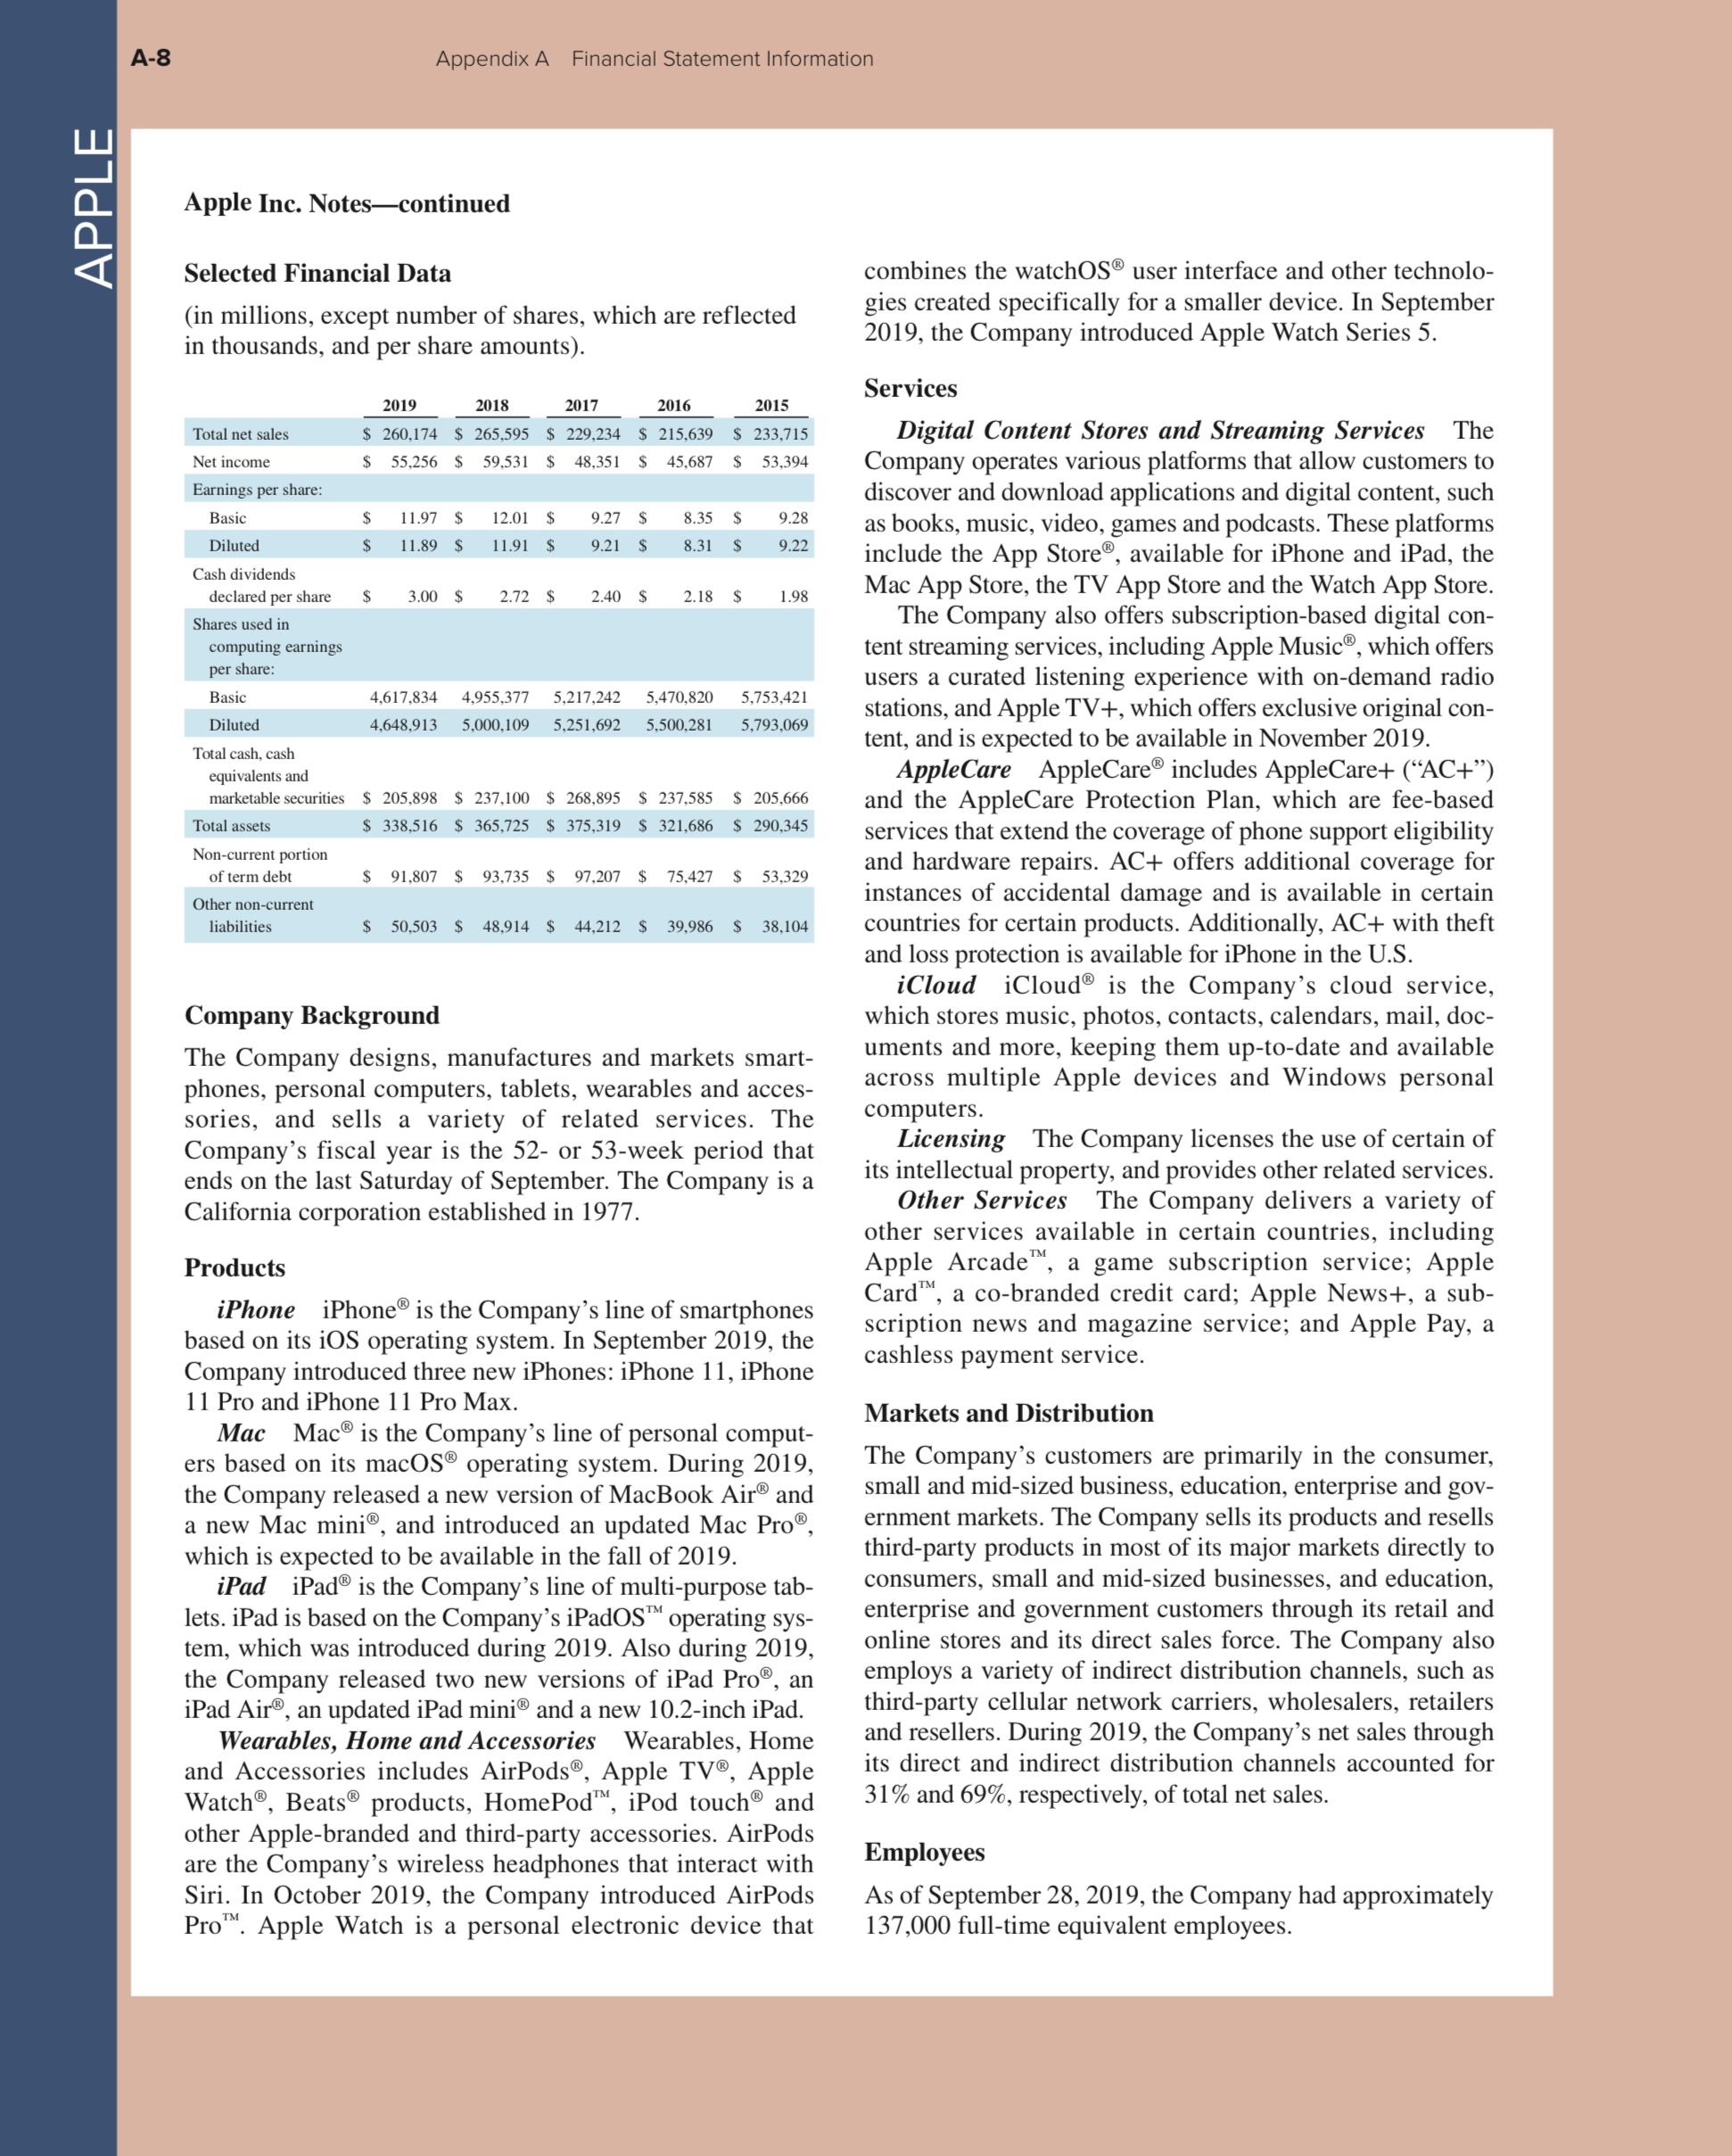
Apple Inc. CONSOLIDATED BALANCE SHEETS (In millions, except number of shares which are reflected in thousands and par value) September 28, 2019 September 29, 2018 ASSETS - - Current assets Cash and cash equivalents 48,844 25913 Marketable securities 51,713 40,388 Accounts receivable, net 22,926 23,186 Inventories 4,106 3,956 Vendor non-trade receivables 22,878 25,809 Other current assets 12,352 12,087 Total current assets 162,819 131,339 Non-current assets Marketable securities 105,341 170,799 Property, plant and equipment, net 37378 41,304 Other non-current assets 32,978 22,283 Total non-current assets 175,697 234,386 Total assets 338,516 365,725 LIABILITIES AND SHAREHOLDERS' EQUITY Current liabilities Accounts payable 46.236 55,888 Other current liabilities 37,720 33,327 Deferred revenue 5522 5,966 Commercial paper 5,980 11,964 Term debt 10,260 8,784 Total current liabilities 105,718 115,929 Non-current liabilities Term debt 91,807 93,735 Other non-current liabilities 50,503 48914 Total non-current liabilities 142,310 142,649 Total liabilities 248,028 258,578 Commitments and contingencies Shareholders' equity Common stock and additional paid-in capital, $0.00001 par value: 12,600,000 shares authorized; 4,443,236 and 4,754,986 shares issued and outstanding, respectively 45,174 40,201 Retained earnings 45,898 70,400 Accumulated other comprehensive income (loss) (584) (3,454) Total shareholders' equity T 90488 o Total liabilities and shareholders\" equity $ 338.516 365,725 See accompanying Notes to Consolidated Financial Statements. Years ended Net sales: Products Services Total net sales Cost of sales: Products Services Total cost of sales Gross margin Operating expenses: Research and development Selling, general and administrative Total operating expenses Operating income Other income (expense), net Income before provision for income taxes Provision for income taxes Net income Earnings per share: Basic Diluted Shares used in computing earnings per share: Basic Diluted Apple Inc. CONSOLIDATED STATEMENTS OF OPERATIONS (In millions, except number of shares which are reflected in thousands and per share amounts) September 28, 2019 213,883 46,291 260,174 144,996 16,786 September 29, 2018 $ 225,847 39,748 265,595 148,164 15,592 September 30, 2017 196,534 32,700 229,234 126,337 14,711 161,782 98,392 16,217 18,245 34,462 63,930 1.807 65,737 10,481 55,256 11.97 11.89 4,617,834 4,648,913 163,756 101,839 14,236 16,705 30,941 70,898 2,005 72,903 13,372 D951 12.01 11.91 4,955,377 5,000,109 141,048 88,186 11,581 15,261 26,842 61,344 2,745 64,089 15,738 48,351 9:27 9.21 5,217,242 5,251,692 See accompanying Notes to Consolidated Financial Statements. Apple Inc. CONSOLIDATED STATEMENTS OF COMPREHENSIVE INCOME (In millions) Years ended September 28, 2019 September 29, 2018 September 30, 2017 Net income $ 55,256 $ 59,531 $ 48,351 Other comprehensive income (loss): Change in foreign currency translation, net of tax (408) (525) 224 Change in unrealized gains/losses on derivative instruments, net of tax: Change in fair value of derivatives (661) 523 1,315 Adjustment for net (gains) losses realized and included in net income 23 (1,477) Total change in unrealized gains/losses on derivative instruments (638) 905 (162) Change in unrealized gains/losses on marketable securities, net of tax: Change in fair value of marketable securities 3,802 (3,407) (782) Adjustment for net (gains) losses realized and included in net income 25 1 (64) Total change in unrealized gains/losses on marketable securities 3,827 (3,406) (846) Total other comprehensive income (loss) 2,781 (3,026) (784) Total comprehensive income $ 58.037 $ 56,505 $ 47.567 See accompanying Notes to Consolidated Financial Statements. Apple Inc. CONSOLIDATED STATEMENTS OF SHAREHOLDERS' EQUITY (In millions) September 28, 2019 September 29, 2018 September 30, 2017 107,147 $ 134,047 $ 128,249 Years ended Total shareholders' equity, beginning balances $ Common stock and additional paid-in capital Beginning balances Common stock issued Common stock withheld related to net share settlement of equity awards Share-based compensation Tax benefit from equity awards, including transfer pricing adjustments 620 Ending balances 40,201 35,867 31,251 781 669 555 (2.002) (1,778) (1.,468) 6,194 5,443 4.909 45,174 40,201 35.867 Retained earnings Beginning balances 70,400 98.330 96,364 Net income 55,256 59,531 48,351 Dividends and dividend equivalents declared (14,129) (13,733) (12,803) Common stock withheld related to net share settlement of equity awards Common stock repurchased Cumulative effects of changes in accounting principles Ending balances (1,029) (948) (581) (67.101) (73.056) (33.001) 2,501 278 = 45,898 70,400 98.330 Accumulated other comprehensive income (loss) Beginning balances Other comprehensive income (loss) Cumulative effects of changes in accounting principles Ending balances Total shareholders' equity, ending balances $ (3,454) (150) 634 2,781 (3.026) 89 (278) (584) (3.454) 90,488 107,147 See accompanying Notes to Consolidated Financial Statements. Apple Inc. CONSOLIDATED STATEMENTS OF CASH FLOWS (In millions) September 28, 2019 September 29, 2018 September 30, 2017 25913 $ 20,289 $ 20,484 Years ended Cash, cash equivalents and restricted cash, beginning balances $ Operating activities Net income Adjustments to reconcile net income to cash generated by operating activities: Depreciation and amortization Share-based compensation expense Deferred income tax expense (benefit) Other Changes in operating assets and liabilities: Accounts receivable, net Inventories Vendor non-trade receivables Other current and non-current assets Accounts payable Deferred revenue Other current and non-current liabilities Cash generated by operating activities Investing activities Purchases of marketable securities Proceeds from maturities of marketable securities Proceeds from sales of marketable securities Payments for acquisition of property, plant and equipment Payments made in connection with business acquisitions, net Purchases of non-marketable securities Proceeds from non-marketable securities Other Cash generated by (used in) investing activities Financing activities Proceeds from issuance of common stock Payments for taxes related to net share settlement of equity awards Payments for dividends and dividend equivalents Repurchases of common stock Proceeds from issuance of term debt, net Repayments of term debt Proceeds from (Repayments of) commercial paper, net Other Cash used in financing activities Increase (decrease) in cash, cash equivalents and restricted cash Cash, cash equivalents and restricted cash, ending balances Supplemental cash flow disclosure: Cash paid for income taxes, net Cash paid for interest 55,256 245 (289) 2931 873 (1,923) (625) (4,700) 59,531 10,903 5,340 (32,590) (444) (5.322) 828 (8,010) (423) 919> 3) 38.449 48,351 10,157 4,840 5,966 (166) (2.093) (2,723) (4,254) (5.318) 8,966 (593) 1,092 69,391 77434 64,225 (39.630) 40,102 56,988 (10,495) (624) (1,001) 1.634 (1,078) 45,896 (71,356) 55,881 47,838 (13.313) (721) (1,871) 353 (745) 16,066 (159.486) 31,775 94,564 (12.451) (329) (521) 126 (124) (46.446) 781 (2.817) (14,119) (66.897) 6.963 (8.805) (5.977) (105) (90.976) 24311 50,224 S 15.263 $ 3.423 669 (2,527) (13,712) (72,738) 6,969 (6,500) 37) (87.876) 5624 $ 25913 $ 10,417 $ 3,022 See accompanying Notes to Consolidated Financial Statements. 555 (1,874) (12,769) (32,900) 28,662 (3,500) 3,852 (17,974) (195) s 20289 $ 11,591 $ 2,092 Appendix A Financial Statement Information APPLE INC. SELECTED NOTES TO CONSOLIDATED FINANCIAL STATEMENTS Basis of Presentation and Preparation In the opinion of the Company's management, the consoli- dated financial statements reflect all adjustments, which are normal and recurring in nature, necessary for fair financial statement presentation. The preparation of these consoli- dated financial statements and accompanying notes in con- formity with U.S. generally accepted accounting principles requires management to make estimates and assumptions that affect the amounts reported. The Company's fiscal year is the 52- or 53-week period that ends on the last Saturday of September. The Company's fiscal years 2019 and 2018 spanned 52 weeks each, whereas fiscal year 2017 included 53 weeks. A 14th week was in- cluded in the first fiscal quarter of 2017, as is done every five or six years, to realign the Company's fiscal quarters with calendar quarters. Unless otherwise stated, references to particular years, quarters, months and periods refer to the Company's fiscal years ended in September and the associ- ated quarters, months and periods of those fiscal years. Revenue Recognition Net sales consist of revenue from the sale of iPhone, Mac, iPad, Services and other products. The Company recognizes revenue at the amount to which it expects to be entitled when control of the products or services is transferred to its custom- ers. Control is generally transferred when the Company has a present right to payment and title and the significant risks and rewards of ownership of products or services are transferred to its customers. For most of the Company's Products net sales, control transfers when products are shipped. For the Compa- ny's Services net sales, control transfers over time as services are delivered. Payment for Products and Services net sales is collected within a short period following transfer of control or commencement of delivery of services, as applicable. The Company records reductions to Products net sales related to future product returns, price protection and other customer incentive programs based on the Company's ex- pectations and historical experience. For arrangements with multiple performance obliga- tions, which represent promises within an arrangement that are capable of being distinct, the Company allocates reve- nue to all distinct performance obligations based on their relative stand-alone selling prices (\"SSPs\"). When avail- able, the Company uses observable prices to determine SSPs. When observable prices are not available, SSPs are established that reflect the Company's best estimates of what the selling prices of the performance obligations would be if they were sold regularly on a stand-alone basis. The Company has identified up to three performance obli- gations regularly included in arrangements involving the sale of iPhone, Mac, iPad and certain other products. The first per- formance obligation, which represents the substantial portion of the allocated sales price, is the hardware and bundled software delivered at the time of sale. The second perfor- mance obligation is the right to receive certain product-related bundled services, which include iCloud, Siri and Maps. The third performance obligation is the right to receive, on a when-and-if-available basis, future unspecified software up- grades relating to the software bundled with each device. The Company allocates revenue and any related discounts to these performance obligations based on their relative SSPs. Be- cause the Company lacks observable prices for the undeliv- ered performance obligations, the allocation of revenue is based on the Company's estimated SSPs. Revenue allocated to the delivered hardware and bundled software is recognized when control has transferred to the customer, which generally occurs when the product is shipped. Revenue allocated to the product-related bundled services and unspecified software upgrade rights is deferred and recognized on a straight-line basis over the estimated period they are expected to be pro- vided. Cost of sales related to delivered hardware and bundled software, including estimated warranty costs, are recognized at the time of sale. Costs incurred to provide product-related bundled services and unspecified software upgrade rights are recognized as cost of sales as incurred. For the sale of third-party products where the Company obtains control of the product before transferring it to the customer, the Company recognizes revenue based on the gross amount billed to customers. The Company considers multiple factors when determining whether it obtains con- trol of third-party products including, but not limited to, evaluating if it can establish the price of the product, retains inventory risk for tangible products or has the responsibility for ensuring acceptability of the product. For thirdparty ap- plications sold through the App Store, Mac App Store, TV App Store and Watch App Store and certain digital content sold through the Company's other digital content stores, the Company does not obtain control of the product before transferring it to the customer. Therefore, the Company ac- counts for such sales on a net basis by recognizing in Services net sales only the commission it retains. The Company has elected to record revenue net of taxes collected from customers that are remitted to governmental au- thorities, with the collected taxes recorded within other current liabilities until remitted to the relevant government authority. Deferred Revenue As of September 28, 2019 and Sep- tember 29, 2018, the Company had total deferred revenue of $8.1 billion and $8.8 billion, respectively. As of September 28, 2019, the Company expects 68% of total deferred reve- nue to be realized in less than a year, 25% within one-to-two years, 6% within two-to-three years and 1% in greater than three years. Advertising Costs Advertising costs are expensed as incurred and included in selling, general and administrative expenses. Appendix A Financial Statement Information Apple Inc. Notescontinued Other Income and Expense $ millions 2019 2018 2017 Interest and dividend income $4961 $5686 $5201 Interest expense (3,576) (3,240) (2,323) Other income (expense), net 422 (441) (133) Total other income (expense), net $ 1,807 @ $ 2,745 Cash Equivalents and Marketable Securities All highly liquid investments with maturities of three months or less at the date of purchase are classified as cash equivalents. The Company's investments in marketable debt securities have been classified and accounted for as avail- able-for-sale. The Company classifies its marketable debt securities as either short-term or long-term based on each instrument's underlying contractual maturity date. Unrealized gains and losses on marketable debt securities classified as available-for-sale are recognized in other com- prehensive income/(loss) (\"OCI). The Company's investments in marketable equity securi- ties are classified based on the nature of the securities and their availability for use in current operations. The Compa- ny's marketable equity securities are measured at fair value with gains and losses recognized in other income/(expense), net (\"OI&E\"). The cost of securities sold is determined us- ing the specific identification method. Restricted Cash and Restricted Marketable Securities The Company considers cash and marketable securities to be restricted when withdrawal or general use is legally re- stricted. The Company records restricted cash as other as- sets in the Consolidated Balance Sheets, and determines current or non-current classification based on the expected duration of the restriction. The Company records restricted marketable securities as current or non-current marketable securities in the Consolidated Balance Sheets based on the classification of the underlying securities. The Company's restricted cash primarily consisted of cash required to be on deposit under a contractual agree- ment with a bank to support the Company's iPhone Up- grade Program. Accounts Receivable (Trade Receivables) The Company has considerable trade receivables outstand- ing with its third-party cellular network carriers, wholesal- ers, retailers, resellers, small and mid-sized businesses and education, enterprise and government customers. As of September 28, 2019, the Company had no custom- ers that individually represented 10% or more of total trade receivables. As of September 29, 2018, the Company had one customer that represented 10% or more of total trade re- ceivables, which accounted for 10%. The Company's cellular network carriers accounted for 51% and 59% of total trade receivables as of September 28, 2019 and September 29, 2018, respectively. Inventories Inventories are measured using the first-in, first-out method. Property, Plant and Equipment Depreciation on property, plant and equipment is recog- nized on a straight-line basis over the estimated useful lives of the assets, which for buildings is the lesser of 30 years or the remaining life of the underlying building; between one and five years for machinery and equipment, including product tooling and manufacturing process equipment; and the shorter of lease term or useful life for leasehold im- provements. Capitalized costs related to internal-use soft- ware are amortized on a straight-line basis over the estimated useful lives of the assets, which range from three to five years. Depreciation and amortization expense on property and equipment was $11.3 billion, $9.3 billion and $8.2 billion during 2019, 2018 and 2017, respectively. $ millions 2019 2018 Land and buildings $17,085 $16.216 Machinery, equipment and internal-use software 69,797 65,982 Leasehold improvements 9,075 8,205 Gross property, plant and equipment 95957 90.403 Accumulated depreciation and amortization (58,579) (49,099) Total property, plant and equipment, net $37,378 $41,304 Fair Value Measurements The fair values of the Company's money market funds and certain marketable equity securities are based on quoted prices in active markets for identical assets. The valuation techniques used to measure the fair value of the Company's debt instruments and all other financial instruments, which generally have counterparties with high credit ratings, are based on quoted market prices or model-driven valuations using significant inputs derived from or corroborated by observable market data. Financial Instruments The Company typically invests in highly rated securities, with the primary objective of minimizing the potential risk of prin- cipal loss. The Company's investment policy generally re- quires securities to be investment grade and limits the amount of credit exposure to any one issuer. Fair values were deter- mined for each individual security in the investment portfolio. Accrued Warranty and Guarantees The following table shows changes in the Company''s accrued warranties and related costs for 2019 and 2018: $ millions 2019 2018 Beginning accrued warranty and related costs ~ $ 3,692 $3,834 Cost of warranty claims (3,857) (4,115) Accruals for product warranty 3.735 3973 Ending accrued warranty and related costs $3,570 $3,692 Apple Inc. Notescontinued Other Non-Current Liabilities $ millions Long-term taxes payable Other non-current liabilities Total other non-current liabilities 2019 2018 $29,545 $33.589 20,958 15,325 $50,503 $48.914 Term Debt As of September 28, 2019, the Company had outstanding floating- and fixed-rate notes with varying maturities for an aggregate principal amount of $101.7 billion (collectively the \"Notes\"). The Notes are senior unsecured obligations and interest is payable in arrears. The Company recognized $3.2 billion, $3.0 billion and $2.2 billion of interest cost on its term debt for 2019, 2018 and 2017, respectively. The future principal payments for the Company's Notes as of September 28, 2019 are as follows (in millions): 2020 $ 10,270 2021 8,750 2022 9,528 2023 9,290 2024 10,039 Thereafter 53,802 Total term debt $101,679 As of September 28, 2019 and September 29, 2018, the fair value of the Company's Notes, based on Level 2 inputs, was $107.5 billion and $103.2 billion, respectively. Share Repurchase Program On April 30, 2019, the Company announced the Board of Directors increased the current share repurchase pro- gram authorization from $100 billion to $175 billion of the Company's common stock, of which $96.1 billion had been utilized as of September 28, 2019. During 2019, the Company repurchased 345.2 million shares of its common stock for $67.1 billion, including 62.0 mil- lion shares delivered under a $12.0 billion accelerated share repurchase arrangement dated February 2019, which settled in August 2019. The Company's share re- purchase program does not obligate it to acquire any spe- cific number of shares. Contingencies The Company is subject to various legal proceedings and claims that have arisen in the ordinary course of business and that have not been fully resolved. The outcome of litigation is inherently uncertain. If one or more legal matters were resolved against the Company in a report- ing period for amounts above management's expectations, the Company's financial condition and operating results for that reporting period could be materially adversely af- fected. In the opinion of management, there was not at least a reasonable possibility the Company may have incurred a material loss, or a material loss greater than a recorded accrual, concerning loss contingencies for asserted legal and other claims, except for the following matters: VirnetX e Qualcomm iOS Performance Management Cases French Competition Authority Disaggregated Revenue by Significant Products and Services Net sales (mil.) 2019 iPhone $142,381 Mac 25,740 iPad 21,280 Wearables, Home and Accessories 24,482 Services Total net sales 2018 $164,888 25,198 18,380 17,381 39,748 $265.595 2017 $139,337 Reportable segment (mil.) 2019 Americas: Net sales Operating income Europe: Net sales Operating income Greater China: Net sales Operating income Japan: Net sales Operating income Rest of Asia Pacific: Net sales Operating income 2018 $116,914 $ 35,099 $112,093 $ 34,864 $96,600 $30,684 $ 60,288 $ 19,195 $ 62,420 $ 19,955 854,938 $16,514 $ 43,678 $ 16,232 $ 51,942 $ 19,742 $44,764 $17,032 $ 21,506 $ 9369 $ 21,733 $ 9.500 $17,733 $ 8,097 $ 17,788 $ 17,407 $ 6,055 $ 6,181 $15,199 $ 5304 A reconciliation of the Company's segment operating income to the Consolidated Statements of Operations for 2019, 2018 and 2017 is as follows: $ millions 2019 2018 Segment operating income $ 85,950 $90,242 Research and development expense 2017 $77,631 (16,217) (5.803) $ 63.930 (14,236) (5.108) $70.898 (11,581) (4,706) $61,344 Other corporate expenses, net Total operating income A-8 Appendix A Financial Statement Information APPLE Apple Inc. Notes-continued Selected Financial Data combines the watchOS user interface and other technolo (in millions, except number of shares, which are reflected gies created specifically for a smaller device. In September in thousands, and per share amounts) 2019, the Company introduced Apple Watch Series 5. Services 2019 2018 2017 2016 2015 Total net sales $ 260,174 $ 265,595 $ 229,234 $ 215,639 $ 233,715 Digital Content Stores and Streaming Services The Net income $ 55,256 $ 59,531 $ 48,351 $ 45,687 $ 53,394 Company operates various platforms that allow customers to Earnings per share: discover and download applications and digital content, such Basic $ 11.97 $ 12.01 $ 9.27 $ 8.35 $ 9.28 as books, music, video, games and podcasts. These platforms Diluted $ 11.89 $ 11.91 $ 9.21 $ 8.31 $ 9.22 include the App Store , available for iPhone and iPad, the Cash dividends declared per share $ 3.00 $ 2.72 $ 2.40 $ 2.18 $ 1.98 Mac App Store, the TV App Store and the Watch App Store. Shares used in The Company also offers subscription-based digital con- computing earnings tent streaming services, including Apple Music, which offers per share: users a curated listening experience with on-demand radio Basic 4,617,834 4,955,377 5,217,242 5,470,820 5,753,421 Diluted 4,648,913 5,000,109 5,251,692 5,500,281 5,793,069 stations, and Apple TV+, which offers exclusive original con- Total cash, cash tent, and is expected to be available in November 2019. equivalents and AppleCare AppleCare includes AppleCare+ ("AC+") marketable securities $ 205,898 $ 237,100 $ 268,895 $ 237,585 $ 205,666 and the AppleCare Protection Plan, which are fee-based Total assets $ 338,516 $ 365,725 $ 375,319 $ 321,686 $ 290,345 services that extend the coverage of phone support eligibility Non-current portion of term debt $ 91,807 $ 93,735 $ 97,207 $ 75,427 $ 53,329 and hardware repairs. AC+ offers additional coverage for Other non-current instances of accidental damage and is available in certain liabilities $ 50,503 $ 48,914 $ 44,212 $ 39,986 $ 38,104 countries for certain products. Additionally, AC+ with theft and loss protection is available for iPhone in the U.S. iCloud iCloud is the Company's cloud service, Company Background which stores music, photos, contacts, calendars, mail, doc- The Company designs, manufactures and markets smart- uments and more, keeping them up-to-date and available phones, personal computers, tablets, wearables and acces- across multiple Apple devices and Windows personal sories, and sells a variety of related services. The computers. Company's fiscal year is the 52- or 53-week period that Licensing The Company licenses the use of certain of ends on the last Saturday of September. The Company is a its intellectual property, and provides other related services. California corporation established in 1977. Other Services The Company delivers a variety of other services available in certain countries, including Products Apple Arcade , a game subscription service; Apple Phone iPhone is the Company's line of smartphones Card", a co-branded credit card; Apple News+, a sub- based on its iOS operating system. In September 2019, the scription news and magazine service; and Apple Pay, a Company introduced three new iPhones: iPhone 11, iPhone cashless payment service. 11 Pro and iPhone 11 Pro Max. Markets and Distribution Mac Macis the Company's line of personal comput- ers based on its macOS operating system. During 2019 The Company's customers are primarily in the consumer, the Company released a new version of MacBook Air and small and mid-sized business, education, enterprise and gov- a new Mac mini, and introduced an updated Mac Pro, ernment markets. The Company sells its products and resells which is expected to be available in the fall of 2019. third-party products in most of its major markets directly to iPad iPad is the Company's line of multi-purpose tab- consumers, small and mid-sized businesses, and education, lets. iPad is based on the Company's iPadOS" operating sys- enterprise and government customers through its retail and tem, which was introduced during 2019. Also during 2019, online stores and its direct sales force. The Company also the Company released two new versions of iPad Pro, an employs a variety of indirect distribution channels, such as iPad Air, an updated iPad mini and a new 10.2-inch iPad. third-party cellular network carriers, wholesalers, retailers Wearables, Home and Accessories Wearables, Home and resellers. During 2019, the Company's net sales through and Accessories includes AirPods, Apple TV, Apple its direct and indirect distribution channels accounted for Watch, Beats products, HomePod", ipod touch and 31% and 69%, respectively, of total net sales. other Apple-branded and third-party accessories. AirPods are the Company's wireless headphones that interact with Employees Siri. In October 2019, the Company introduced AirPods As of September 28, 2019, the Company had approximately Pro". Apple Watch is a personal electronic device that 137,000 full-time equivalent employees
Step by Step Solution
There are 3 Steps involved in it
1 Expert Approved Answer
Step: 1 Unlock
Question Has Been Solved by an Expert!
Get step-by-step solutions from verified subject matter experts
Step: 2 Unlock
Step: 3 Unlock
Students Have Also Explored These Related Finance Questions!