

Question: Using Arrays to Analyze Data ( 1 3 ) Overview This HW problem will help you solidify your data analysis / manipulation skills in MATLAB.
Using Arrays to Analyze Data
Overview
This HW problem will help you solidify your data analysismanipulation skills in MATLAB. Data is often given to you in a certain format and you must work
is Here, you are given student grades organized as described below and asked to manipulate the grade data accordingly.
Working with data in arrays can be challenging, especially if you haven't done it before. You will likely be much more successful if you visualize the data
desired results by writing out the arrays by hand. This kind of visualization can make a coding task that initially seems intractable seem much more cle
feasible.
Problem Information
The grading scheme for an intro physics course is
HW:
Exams:
Labs:
Final Project
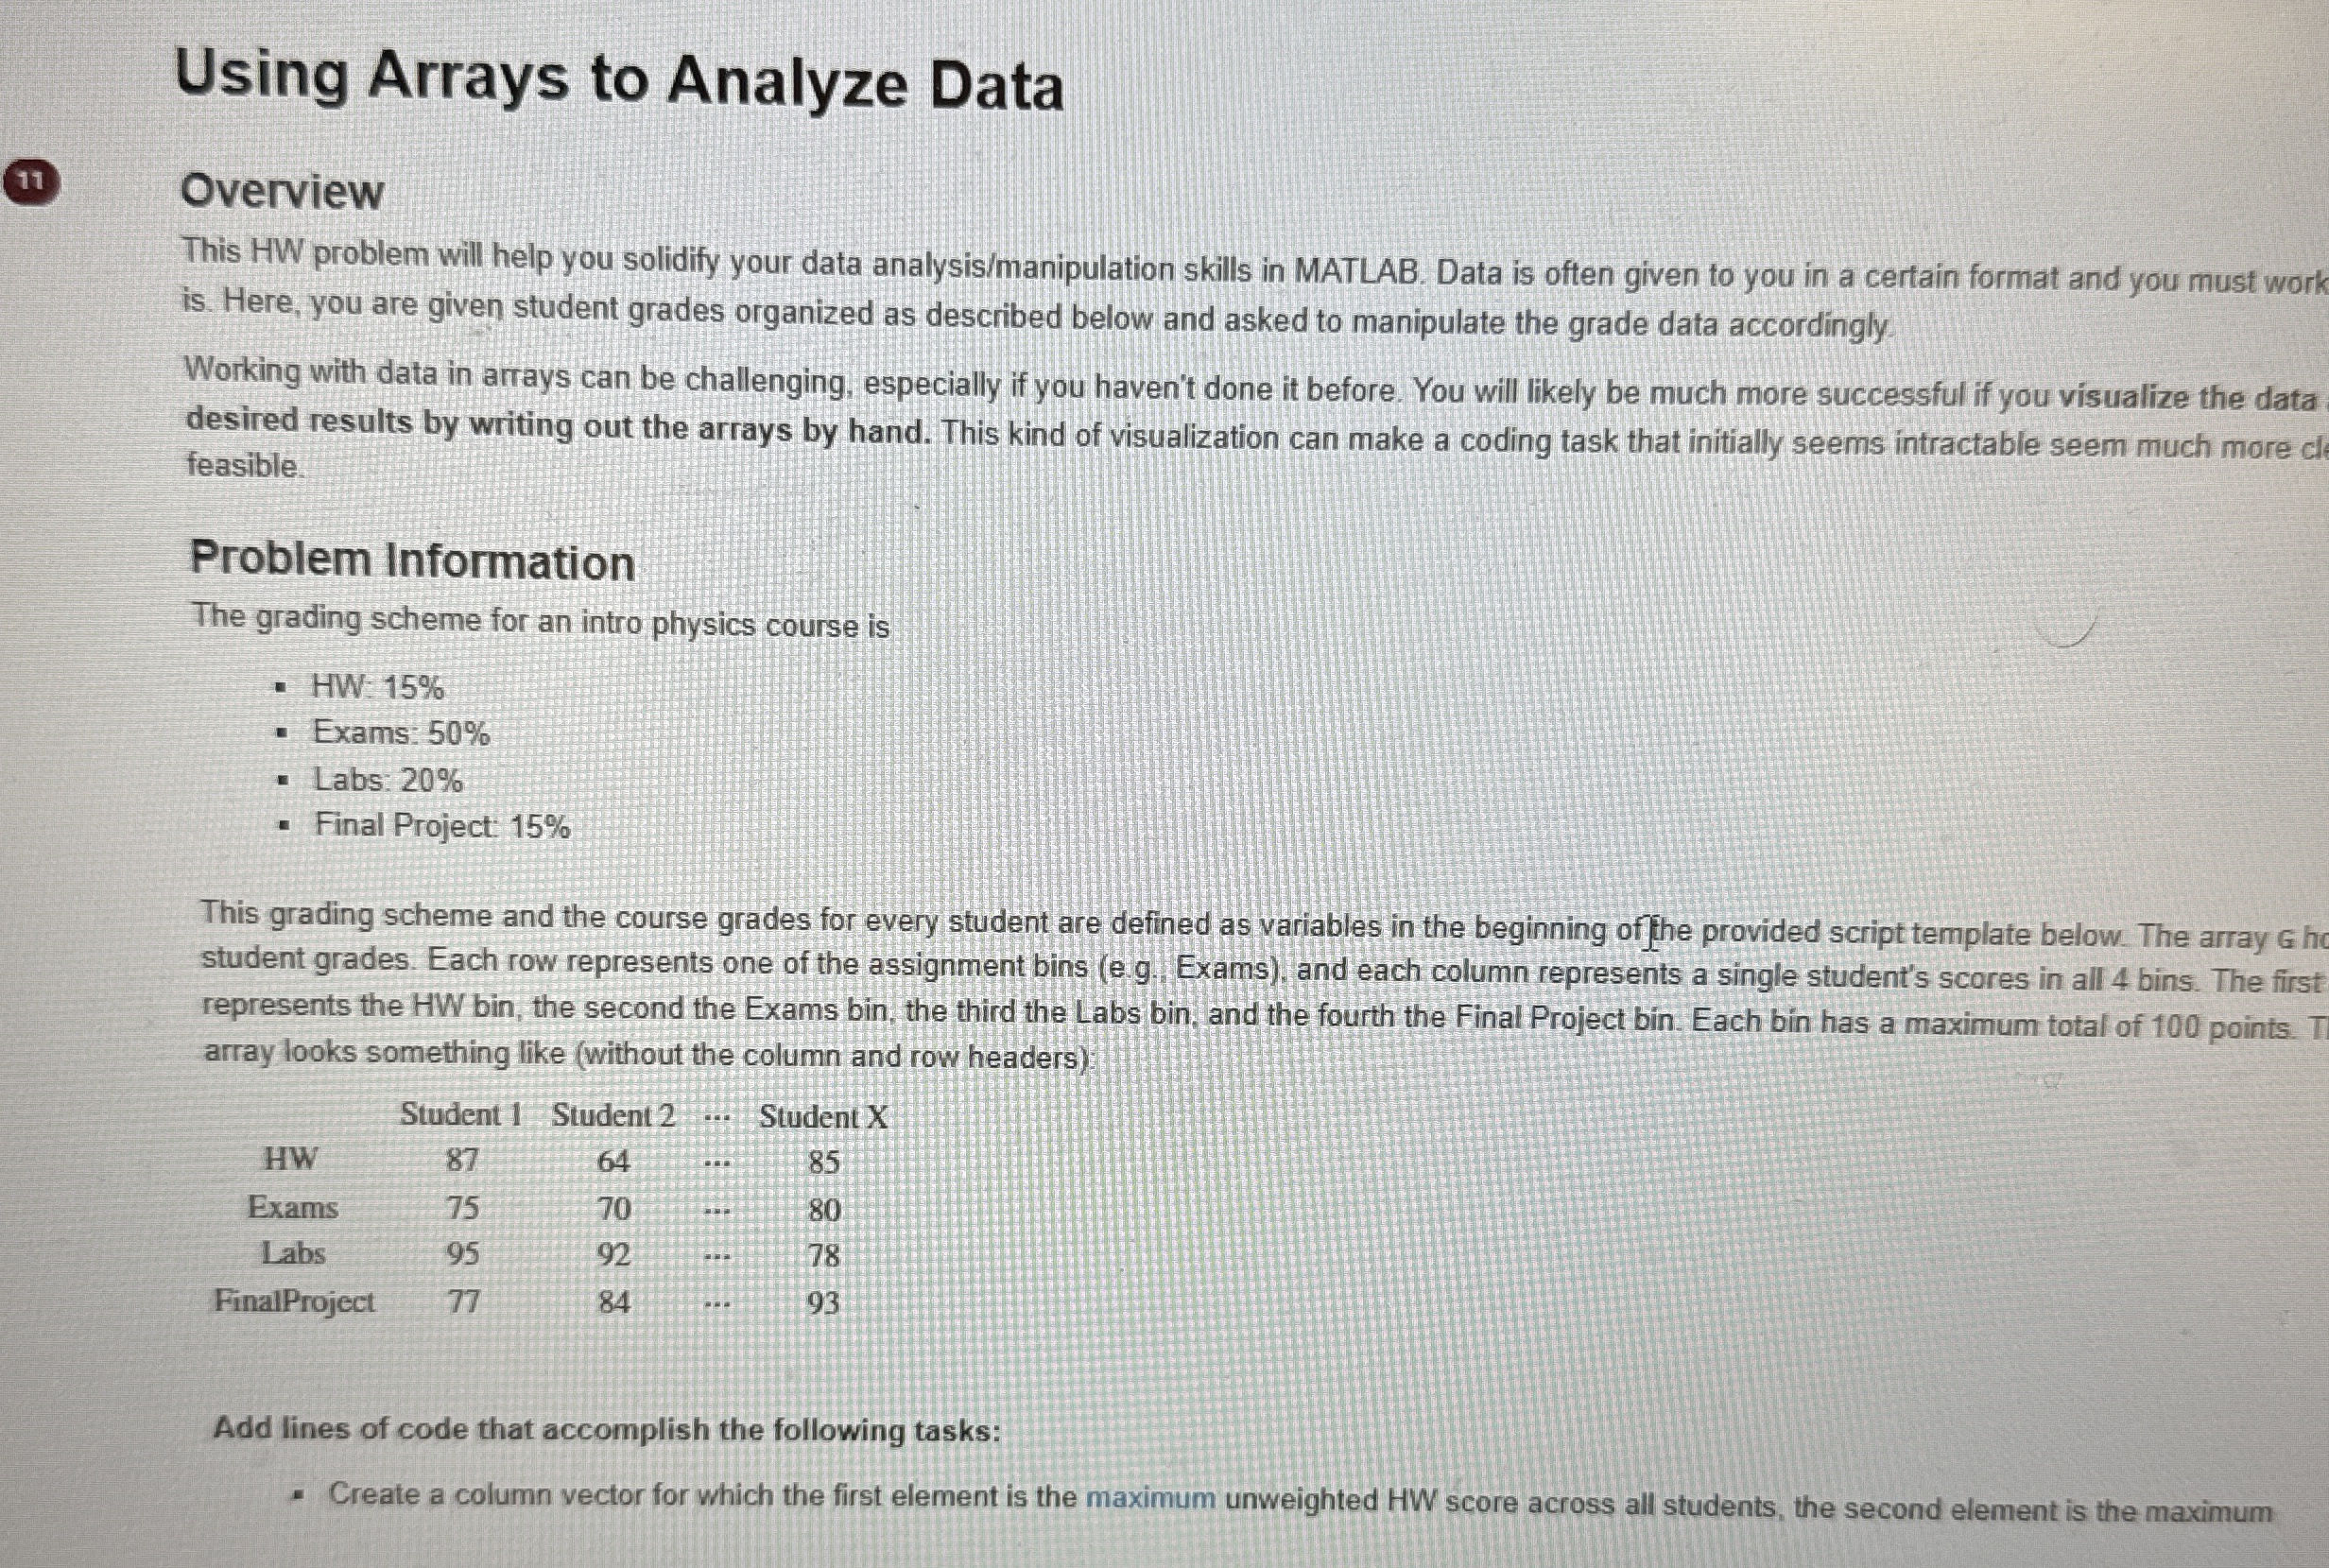
This grading scheme and the course grades for every student are defined as variables in the beginning of fhe provided script template below. The array ho
student grades. Each row represents one of the assignment bins eg Exams and each column represents a single student's scores in all bins. The first
represents the HW bin, the second the Exams bin, the third the Labs bin, and the fourth the Final Project bin. Each bin has a maximum total of points. T
array looks something like without the column and row headers
Add lines of code that accomplish the following tasks:
Create a column vector for which the first element is the maximum unweighted HW score across all students, the second element is the maximum
Step by Step Solution
There are 3 Steps involved in it
1 Expert Approved Answer
Step: 1 Unlock

Question Has Been Solved by an Expert!
Get step-by-step solutions from verified subject matter experts
Step: 2 Unlock
Step: 3 Unlock