

Question: Using box-and-whisker plots to compare data sets V Two English classes with the same number of students took a final exam. The box-and-whisker plots below
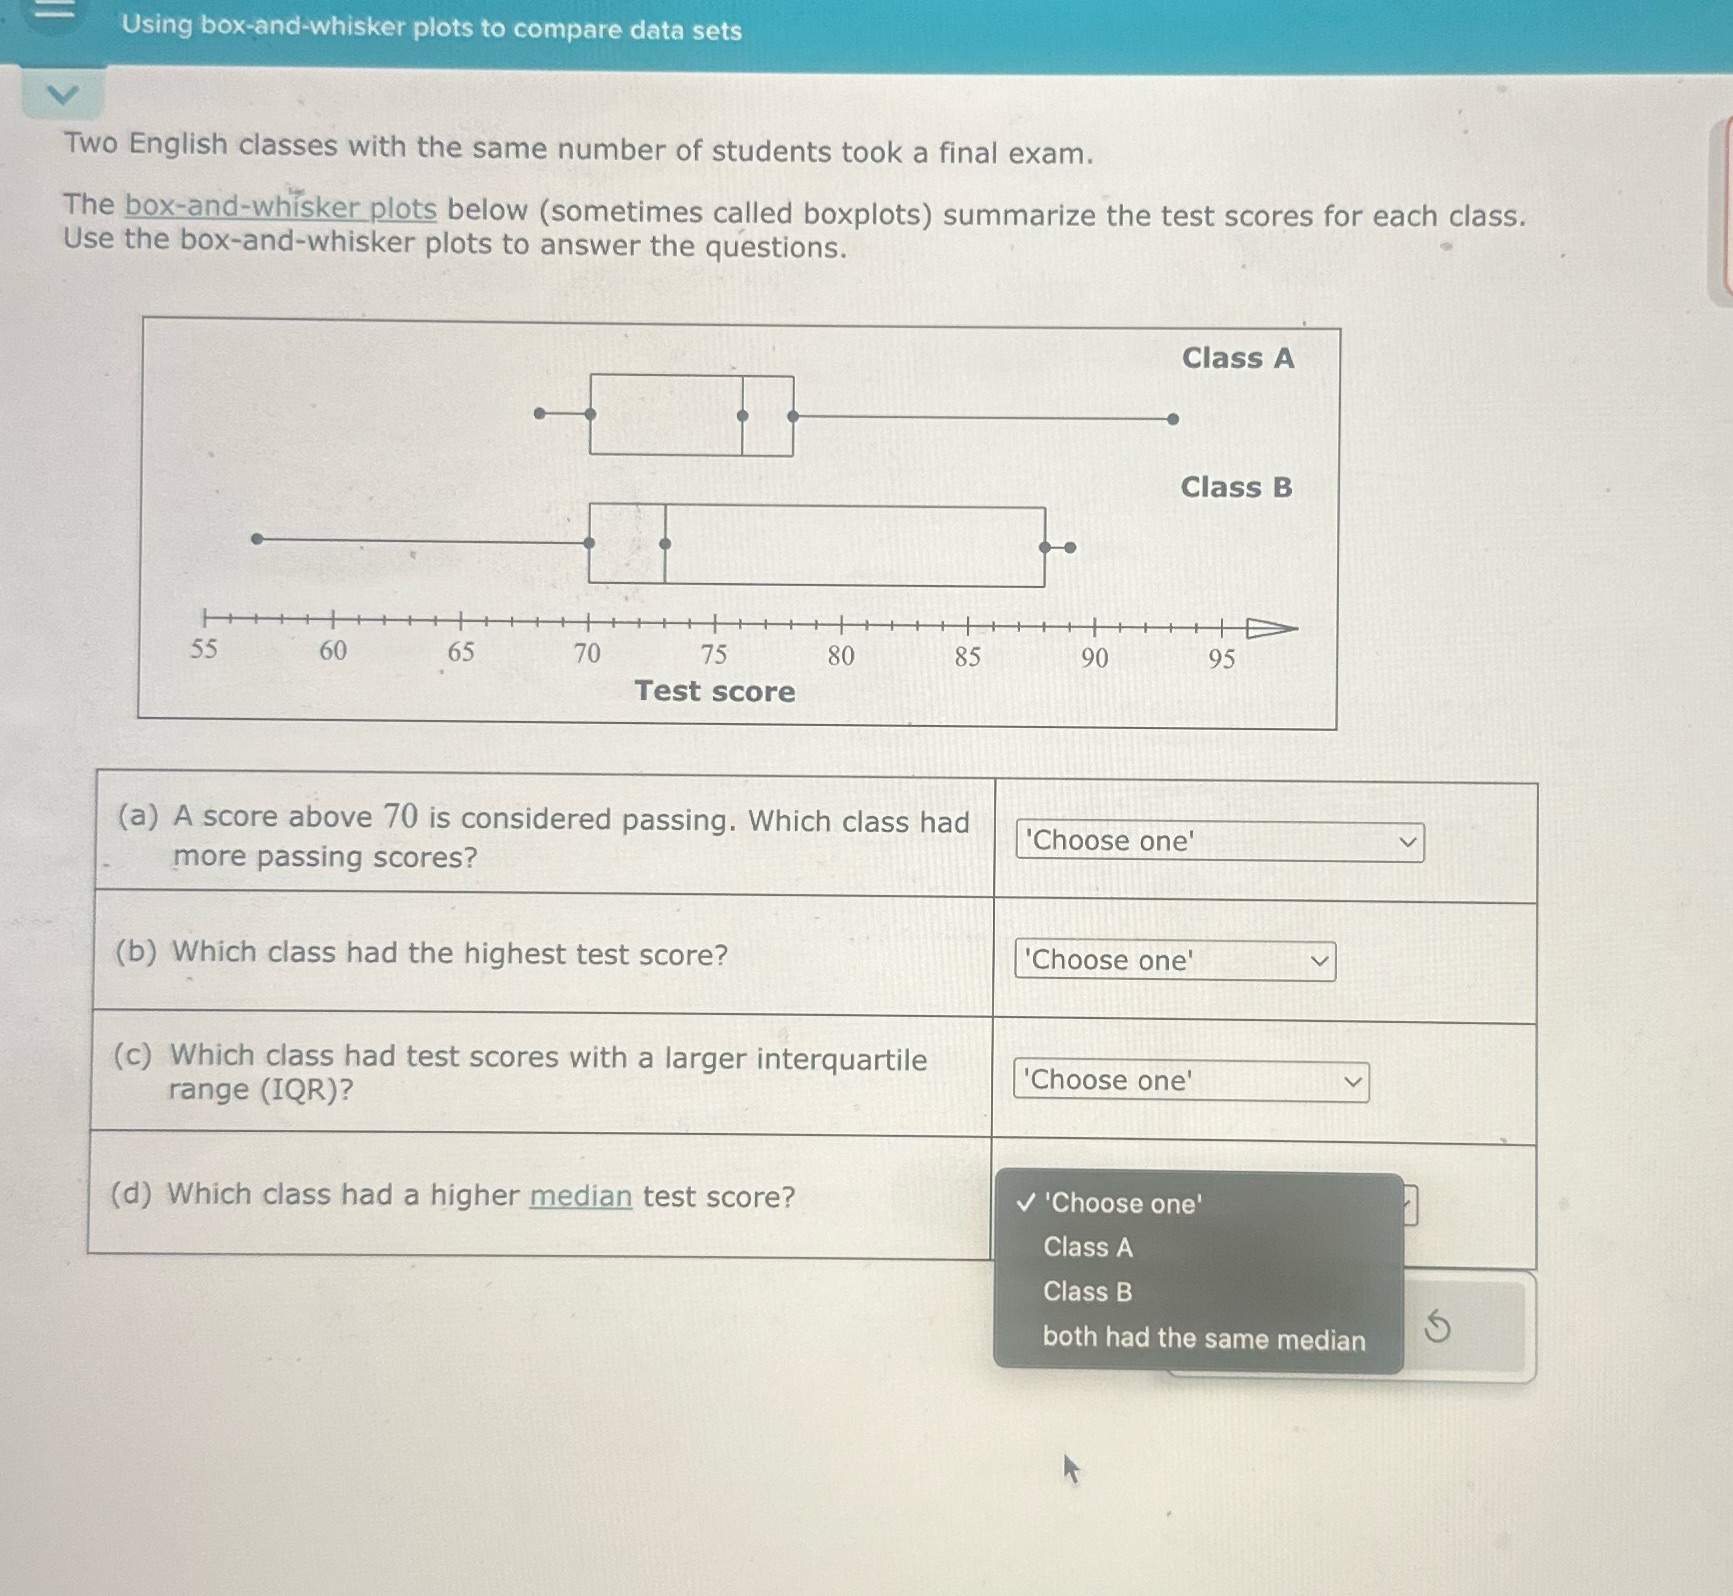
Using box-and-whisker plots to compare data sets V Two English classes with the same number of students took a final exam. The box-and-whisker plots below (sometimes called boxplots) summarize the test scores for each class. Use the box-and-whisker plots to answer the questions. Class A Class B 55 60 65 70 75 80 85 90 95 Test score (a) A score above 70 is considered passing. Which class had 'Choose one' V more passing scores? (b) Which class had the highest test score? 'Choose one' v (c) Which class had test scores with a larger interquartile range (IQR)? 'Choose one (d) Which class had a higher median test score? V 'Choose one' Class A Class B both had the same median
Step by Step Solution
There are 3 Steps involved in it

Get step-by-step solutions from verified subject matter experts