

Question: Using C chart Part C and D important Question Two (50 points) The data in below table represent the number of nonconformities per 1000 meters
Using C chart
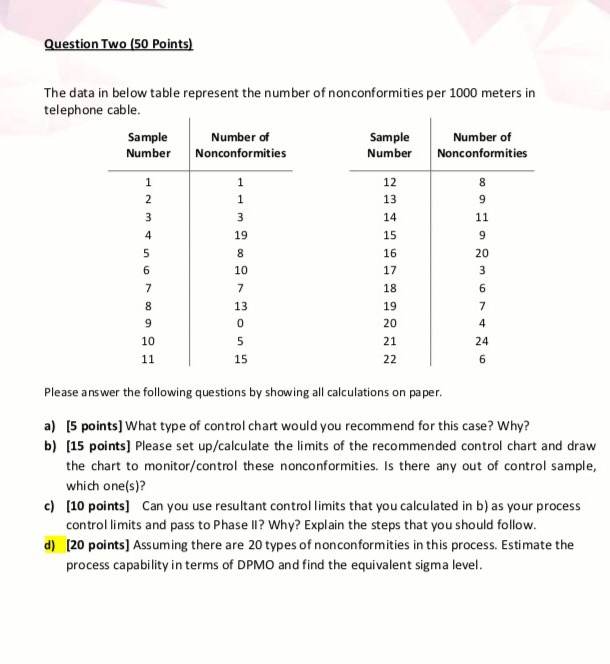
Question Two (50 points) The data in below table represent the number of nonconformities per 1000 meters in telephone cable. Sample Number of Sample Number of Number Nonconformities Number Nonconformities 1 1 8 9 1 2 3 12 13 14 15 3 4 19 5 6 7 8 9 10 11 8 10 7 13 0 16 17 18 19 20 11 9 20 3 6 7 4 5 24 21 22 15 6 Please answer the following questions by showing all calculations on paper. a) [5 points] What type of control chart would you recommend for this case? Why? b) (15 points) Please set up/calculate the limits of the recommended control chart and draw the chart to monitor/control these nonconformities. Is there any out of control sample, which one(s)? c) [10 points) Can you use resultant control limits that you calculated in b) as your process control limits and pass to Phase II? Why? Explain the steps that you should follow. d) [20 points) Assuming there are 20 types of nonconformities in this process. Estimate the process capability in terms of DPMO and find the equivalent sigma level Part C and D important
Step by Step Solution
There are 3 Steps involved in it
1 Expert Approved Answer
Step: 1 Unlock

Question Has Been Solved by an Expert!
Get step-by-step solutions from verified subject matter experts
Step: 2 Unlock
Step: 3 Unlock