

Question: using c++ create a function to read in and display a graph using coordinates below [0, 0]-41 [0, 1]-93 [0, 2]-90 [0, 3]-24 [0, 4]-70
using c++ create a function to read in and display a graph using coordinates below
[0, 0]-41 [0, 1]-93 [0, 2]-90 [0, 3]-24 [0, 4]-70 [0, 5]-39 [0, 6]-47 [0, 7]-35 [0, 8]-83 [1, 0]-38 [1, 1]-66 [1, 2]-45 [1, 3]-11 [1, 4]-53 [1, 5]-35 [1, 6]-88 [1, 7]-75 [1, 8]-21 [2, 0]-56 [2, 1]-81 [2, 2]-34 [2, 3]-76 [2, 4]-53 [2, 5]-44 [2, 6]-70 [2, 7]-38 [2, 8]-32 [3, 0]-86 [3, 1]-13 [3, 2]-23 [3, 3]-93 [3, 4]-68 [3, 5]-26 [3, 6]-53 [3, 7]-52 [3, 8]-29 [4, 0]-76 [4, 1]-60 [4, 2]-43 [4, 3]-82 [4, 4]-40 [4, 5]-72 [4, 6]-48 [4, 7]-29 [4, 8]-75 [5, 0]-16 [5, 1]-49 [5, 2]-36 [5, 3]-53 [5, 4]-18 [5, 5]-47 [5, 6]-27 [5, 7]-98 [5, 8]-78 [6, 0]-68 [6, 1]-63 [6, 2]-33 [6, 3]-92 [6, 4]-27 [6, 5]-48 [6, 6]-13 [6, 7]-15 [6, 8]-37 [7, 0]-47 [7, 1]-3 [7, 2]-8 [7, 3]-17 [7, 4]-62 [7, 5]-62 [7, 6]-14 [7, 7]-35 [7, 8]-84 [8, 0]-7 [8, 1]-23 [8, 2]-63 [8, 3]-24 [8, 4]-37 [8, 5]-18 [8, 6]-44 [8, 7]-6 [8, 8]-18
Expected output shown below
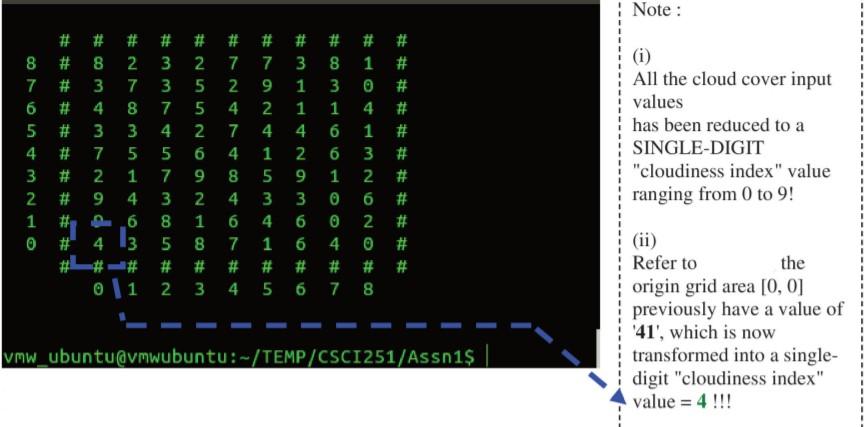
Note : #7247 # # # # # # # # # # # 8 # 8 2 2 7 7 3 8 1 # 7 # 7 5 9 1 3 6 # 4 8 5 2 1 1 4 # 5 # 3 2 4 4 6 1 # 4. # 7 5 6 4 1 2 6. 3 # 3 # 2 9 8 5 9 1 2 # 2 # 9 4 4 3 6 # 1 #06 8 1 6 4 6 0 2 # 0 # 4 3 5 8 7 1 4 0 # # # # # # # # oli 2 3 4 5 6 7 8 NRW 00 www (i) All the cloud cover input values has been reduced to a SINGLE-DIGIT "cloudiness index" value ranging from 0 to 9! 3 3 N 6 Refer to the origin grid area [0, 0] previously have a value of '41', which is now transformed into a single- digit cloudiness index" value = 4 !!! vmw_ubuntu@vmwubuntu:-/TEMP/CSCI251/Assn1$
Step by Step Solution
There are 3 Steps involved in it

Get step-by-step solutions from verified subject matter experts