

Question: using c + + graphics ( graphlib 2 0 2 2 , graph.h ) I need my progam to constuct a bar graph like in
using c graphics graphlib graph.h I need my progam to constuct a bar graph like in the image. In the function void displayResultsint sales int nomonths, int max, int min, double avg;
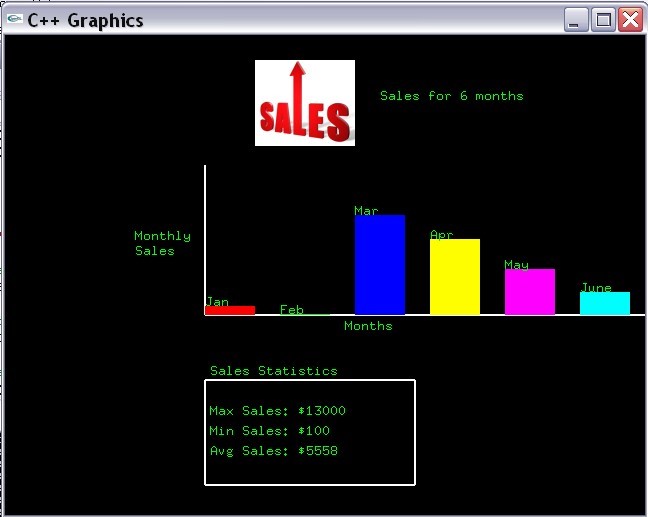
For this example, month # corresponds to January, month # corresponds to February, and so on up to June corresponding to month # This program will next display the sales data in the form of a bar chart. The bar chart that this program generates consists of the following:
An xy axis
Rectangles representing the percentage of sales for a given month
The given months abbreviation displayed above its rectangle
An image and text used as the bar charts headingtitle
An informational box containing a summary of the sales data statistics
Note that the height of each rectangle is based on the sales for that given month. The equation for computing the height for each rectangle is:
height doublesalesimax;
where salesi is the ith sales value, and max is the maximum sales value for this example its The variable height is measured in pixels and should be declared as an int. The minimum value for height is set to not In other words, if height reset it to exactly The suggested width of each rectangle is The suggested horizontal distance between each rectangle is The suggested length of the vertical axis is px while the suggested length of the horizontal axis is px
Note: For this example, the height for Feb is computed as
height
which results in an integer value of Since the minimum allowable value for height is reset height to not
Observe that there is a very small green rectangle under the Feb heading that has a height of only pixel. This is due to the sales for the month of Feb is
Each months rectangle should be colored as follow:
January Red
February Green
March Blue
April Yellow
May Magenta
June Turquoise
This is what I have so far
#include
#include "graphh
#include
using namespace std;
int getNoMonths;
void getSalesint sales int nomonths;
int getMaxint sales int nomonths;
int getMinint sales int nomonths;
double getAverageint sales int nomonths;
void displayResultsint sales int nomonths, int max, int min, int avg;
const int MAXMONTHS ;
int main
int nomonths ;
int salesMAXMONTHS;
int maxSale;
int minSale;
double avg;
int intAvg;
displayGraphics;
nomonths getNoMonths;
getSalessales nomonths;
maxSale getMaxsales nomonths;
minSale getMinsales nomonths;
avg getAveragesales nomonths;
intAvg intavg;
displayResultssales nomonths, maxSale, minSale, intAvg;
return ;
int getNoMonths
int months;
Prompt user until a valid input is entered
do
std::cout "Enter the number of months to process between and : ;
std::cin months;
Check if the input is valid
if months months
std::cout "Invalid entry. Please enter a number between and
;
while months months ;
return months;
void getSalesint sales int nomonths
for int i ; i nomonths; i
cout "Enter sales data for month i : ;
cin salesi;
int getMaxint sales int nomonths
int max sales;
forint i ; i nomonths; i
if salesi max
max salesi;
return max;
int getMinint sales int nomonths
int min sales;
forint i ; i nomonths; i
if salesi min
min salesi;
return min;
double getAverageint sales int nomonths
double total ;
double average ;
cout fixed setprecision endl;
for int i ; i nomonths; i
total salesi;
average staticcasttotal nomonths;
double roAvg pow;
average roundaverage roAvg roAvg;
return average;
void displayResultsint sales int nomonths, int max, int min, int avg
const int RECTWIDTH ;
const int DISTANCEBETWEEN ;
const char monthNamesMAXMONTHS "Jan", "Feb", "Mar", "Apr", "May", "Jun" ;
for int i ; i nomonths; i
int height staticcastdoublesalesi max;
if height
height ;
gout setPos "Max Sales: $ max endg;
gout setPos "Min Sales: $ min endg;
gout setPos "Avg Sales: $ avg endg;
gout setPos "Sales Statistics" endg;
Step by Step Solution
There are 3 Steps involved in it
1 Expert Approved Answer
Step: 1 Unlock

Question Has Been Solved by an Expert!
Get step-by-step solutions from verified subject matter experts
Step: 2 Unlock
Step: 3 Unlock