

Question: Using category names in Education Observed and Expected Counts Test Contribution Category Observed Proportion Expected to Chi-Square Bachelor 22 0.333333 22 0.000000 Graduate 19 0.333333
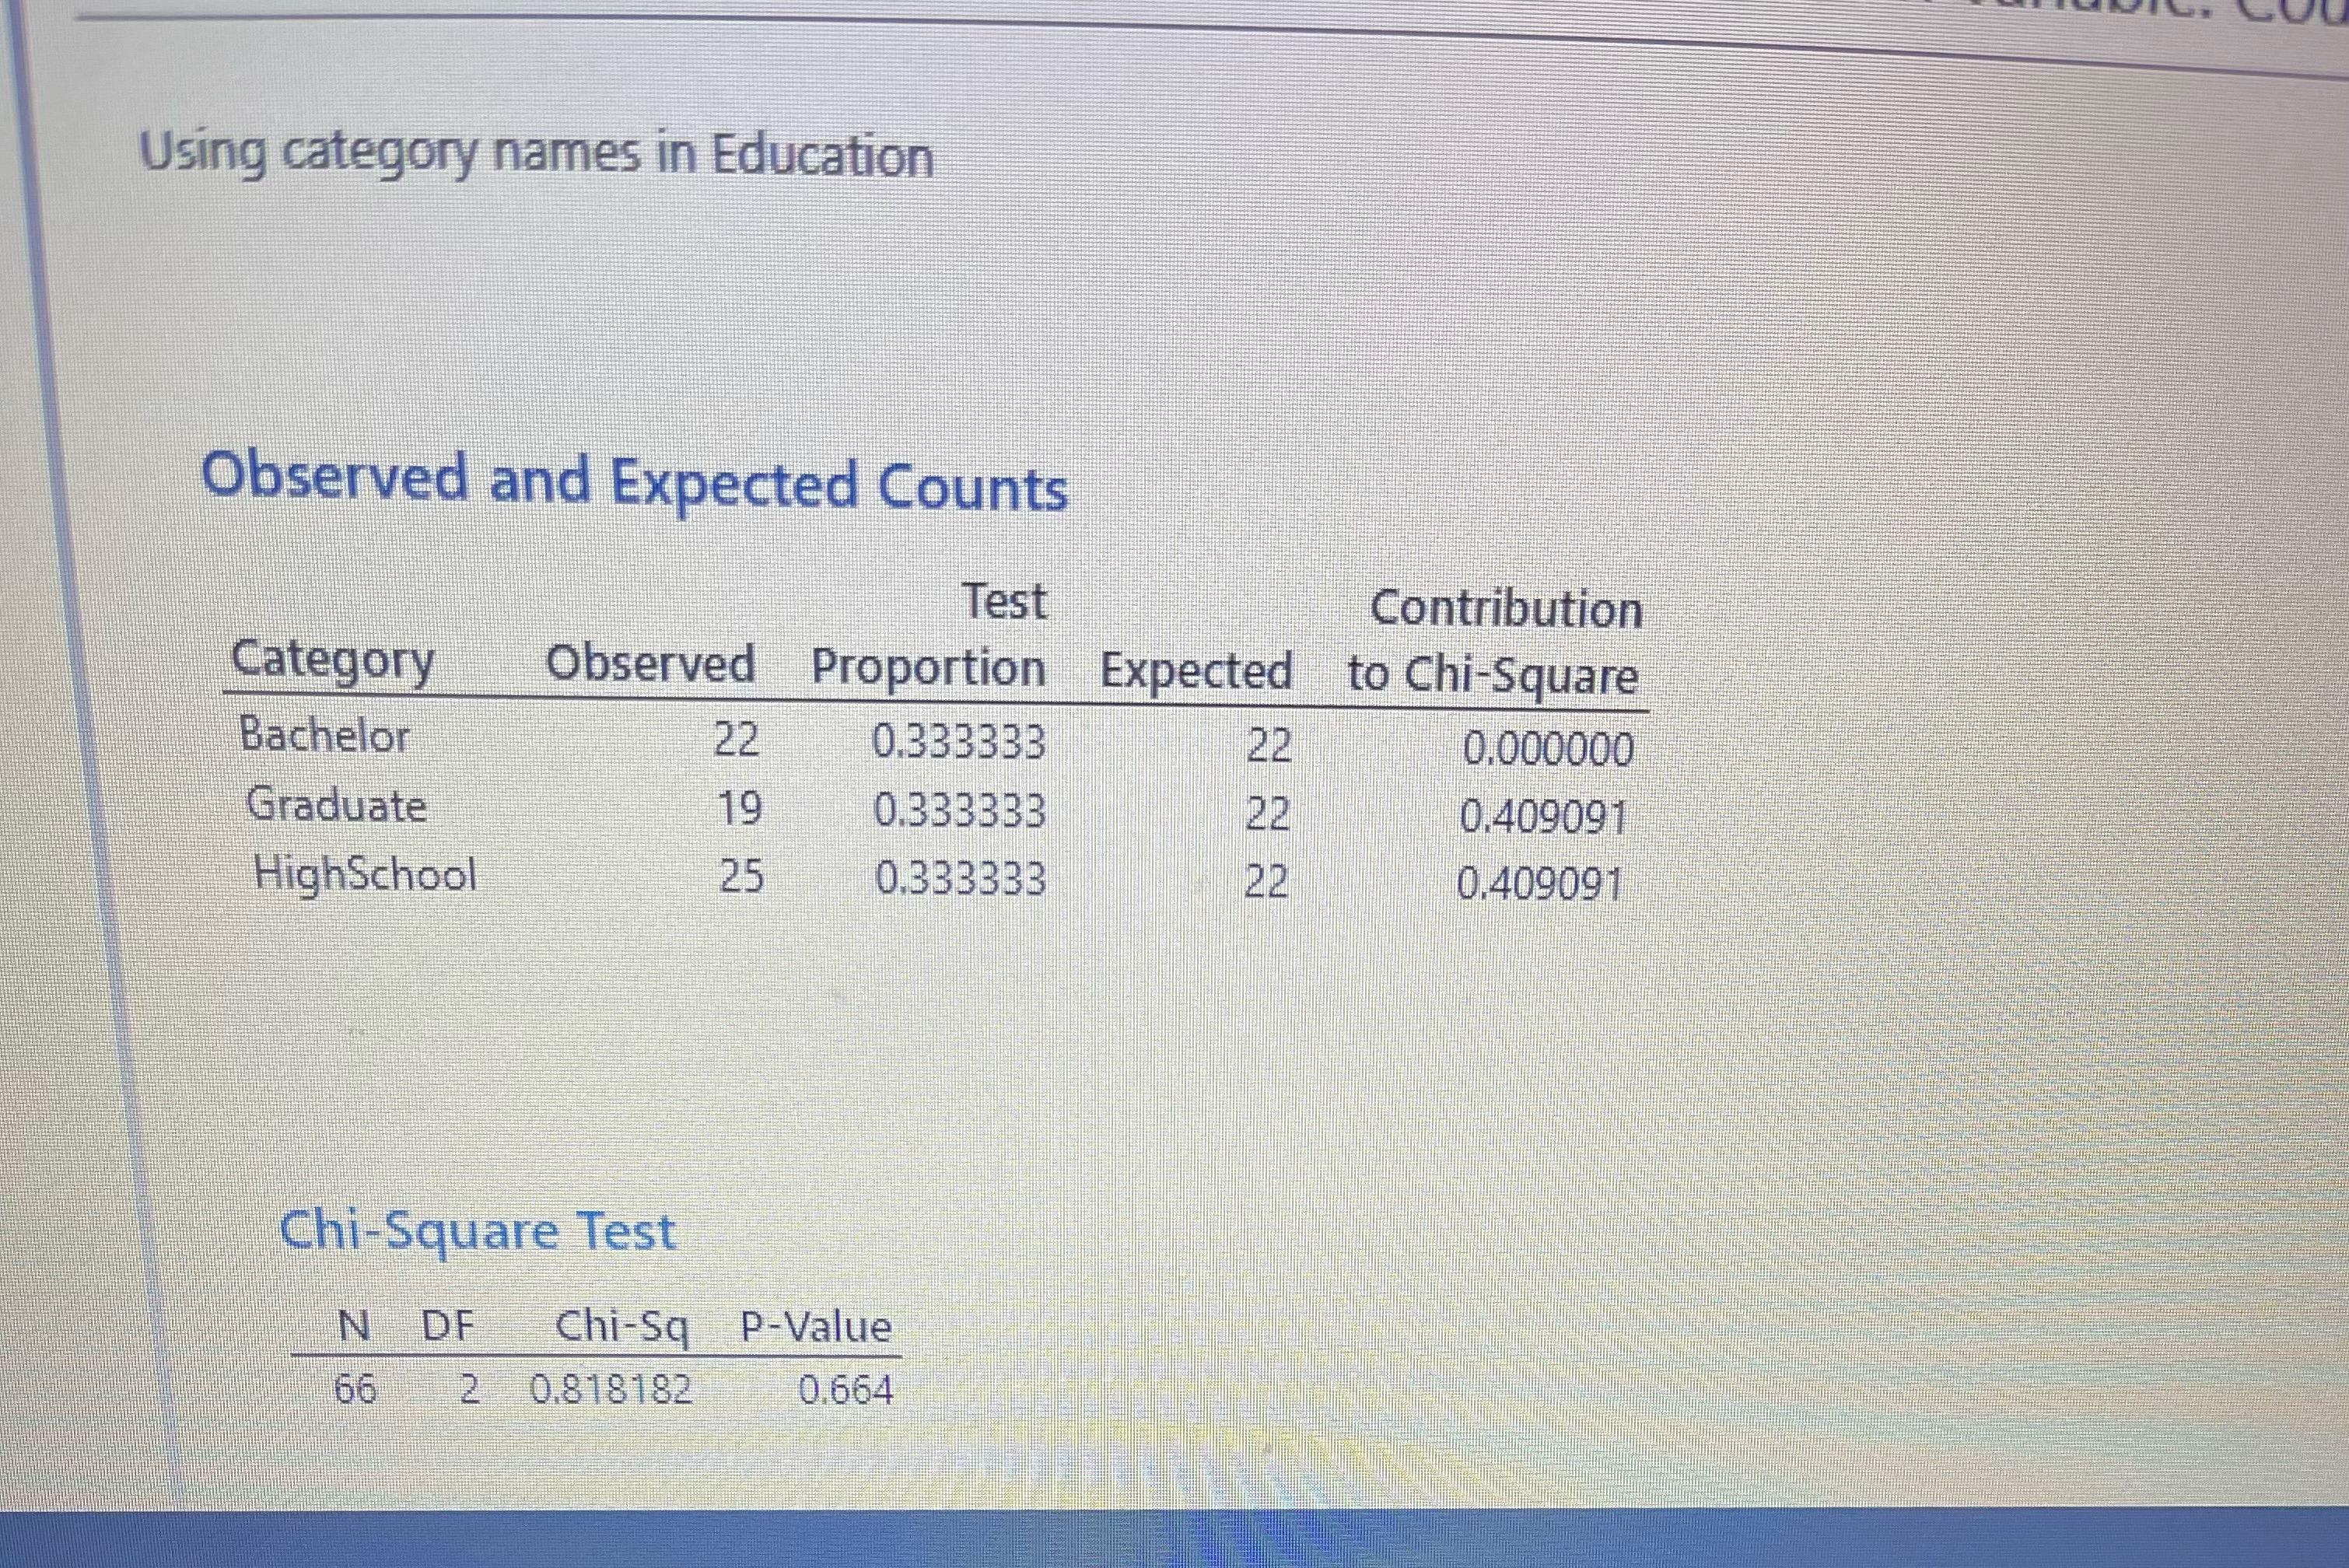
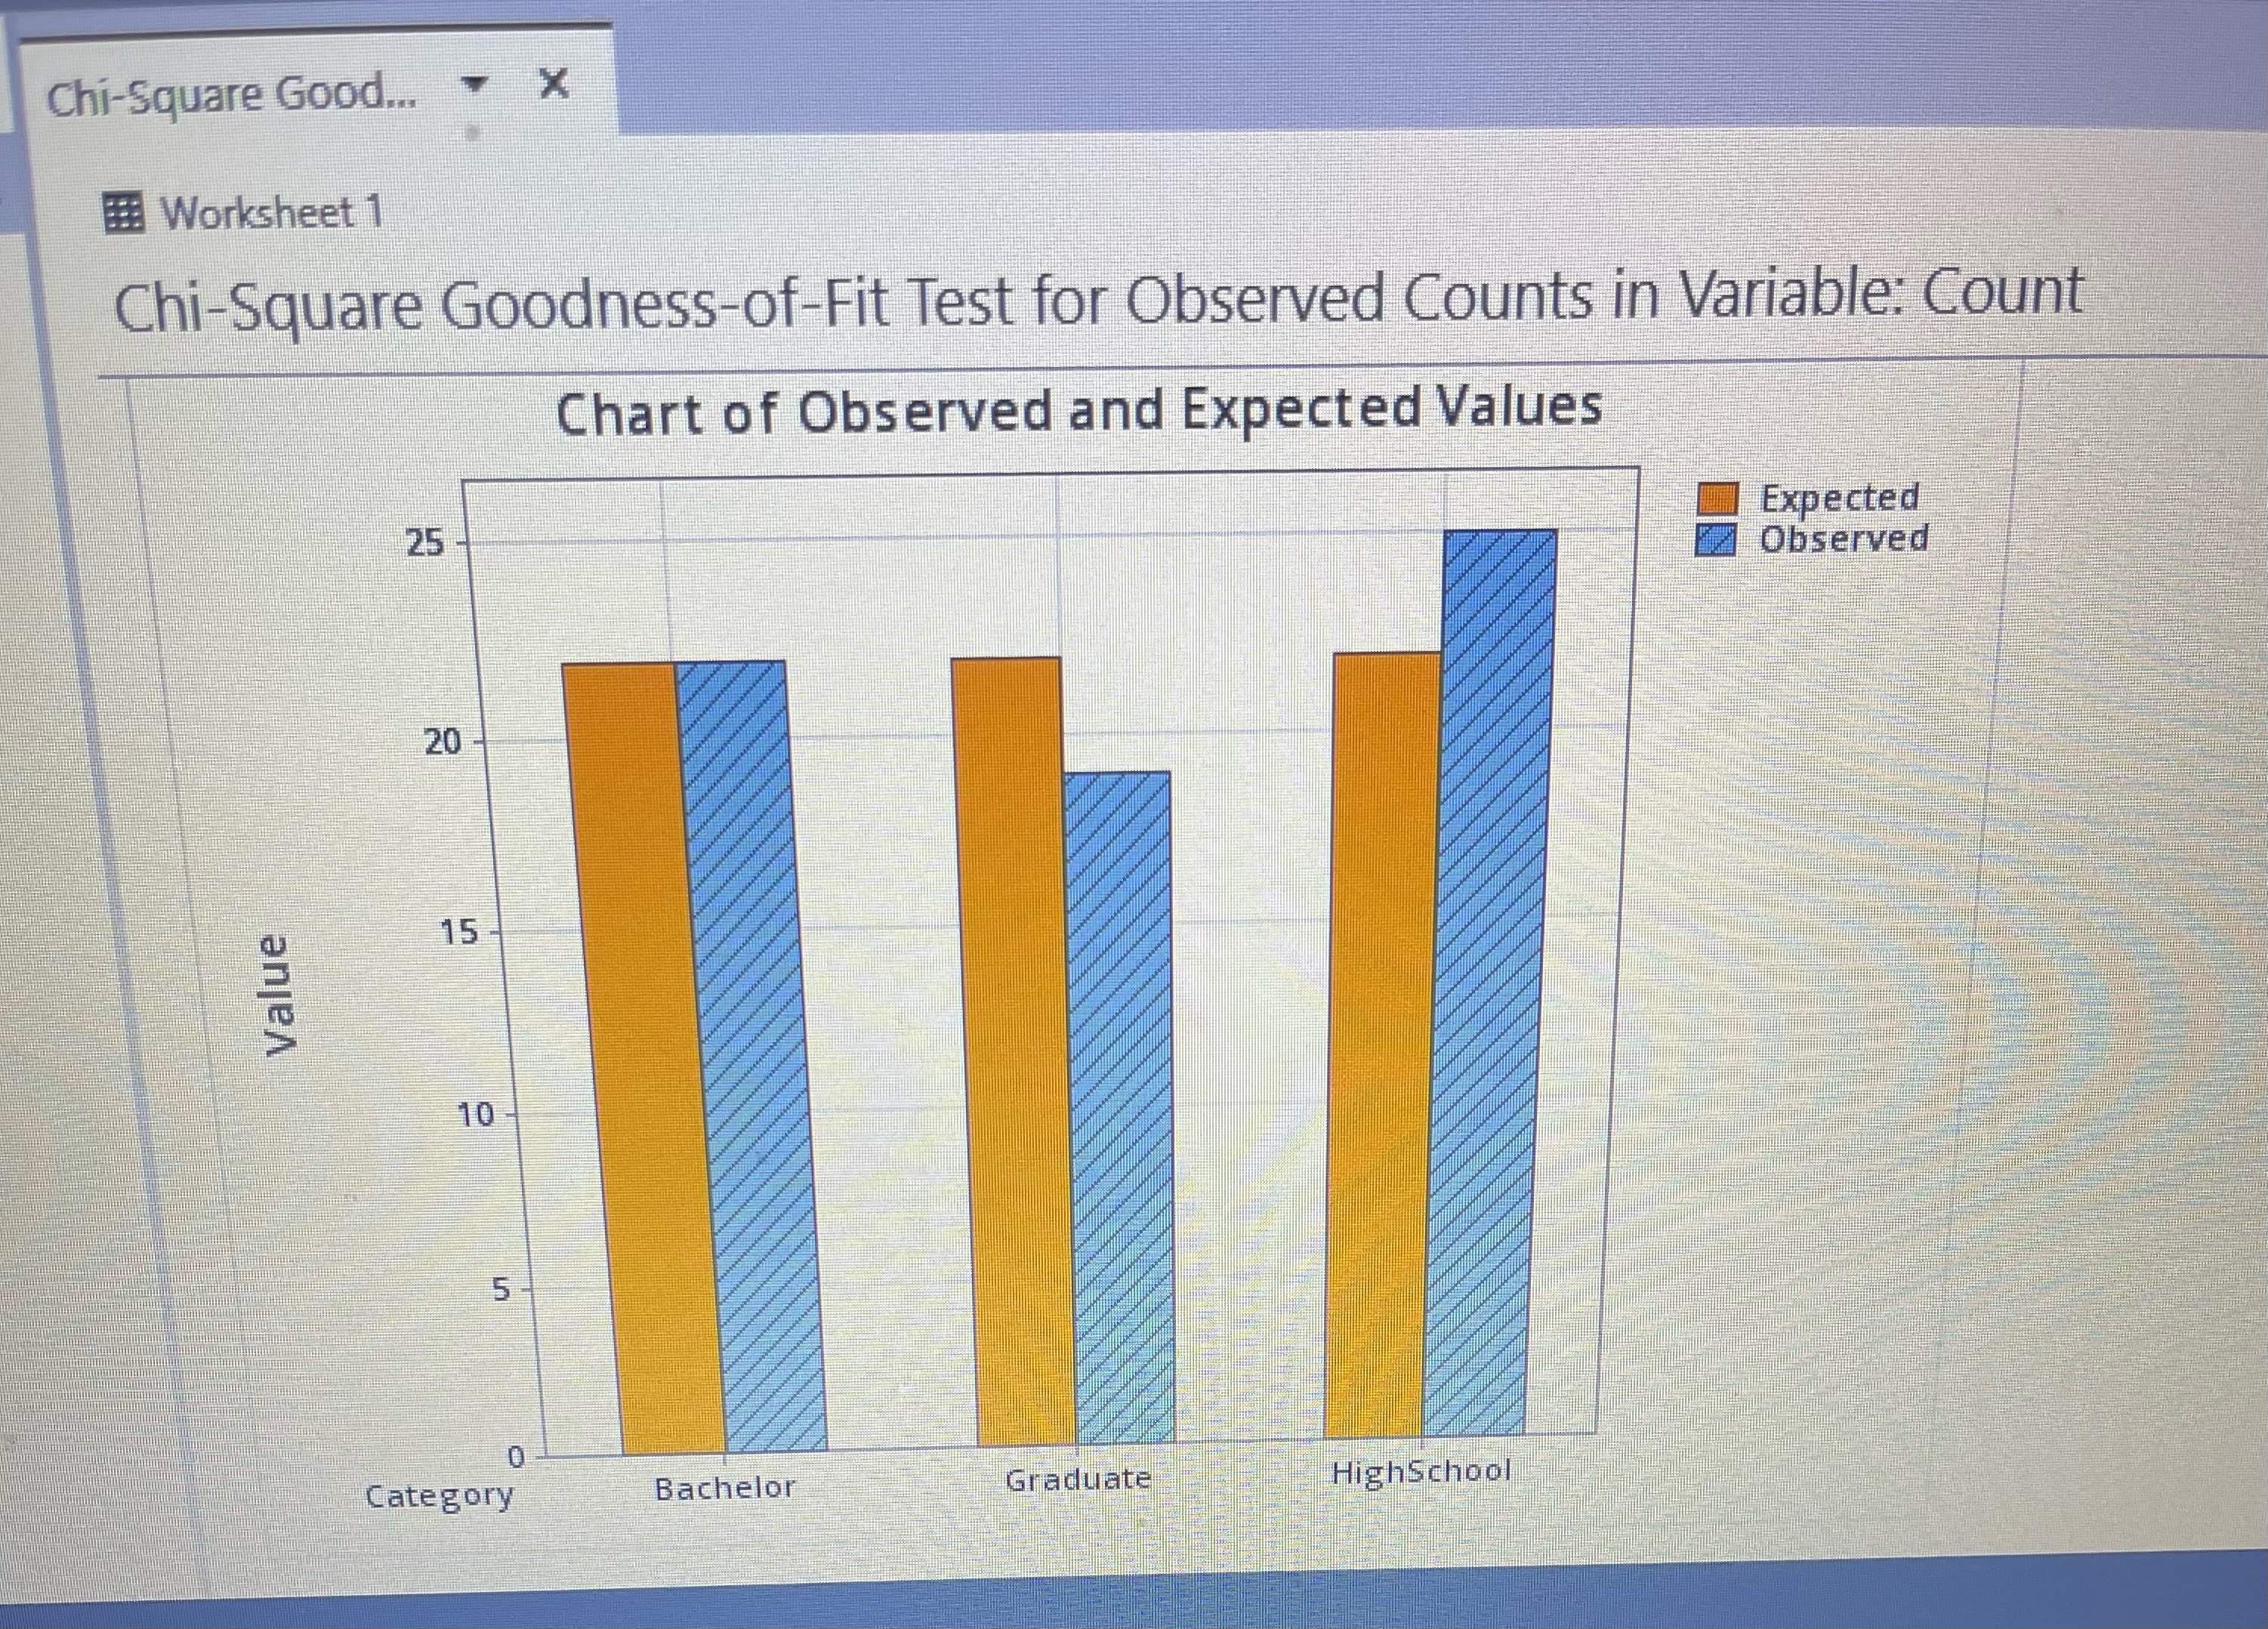
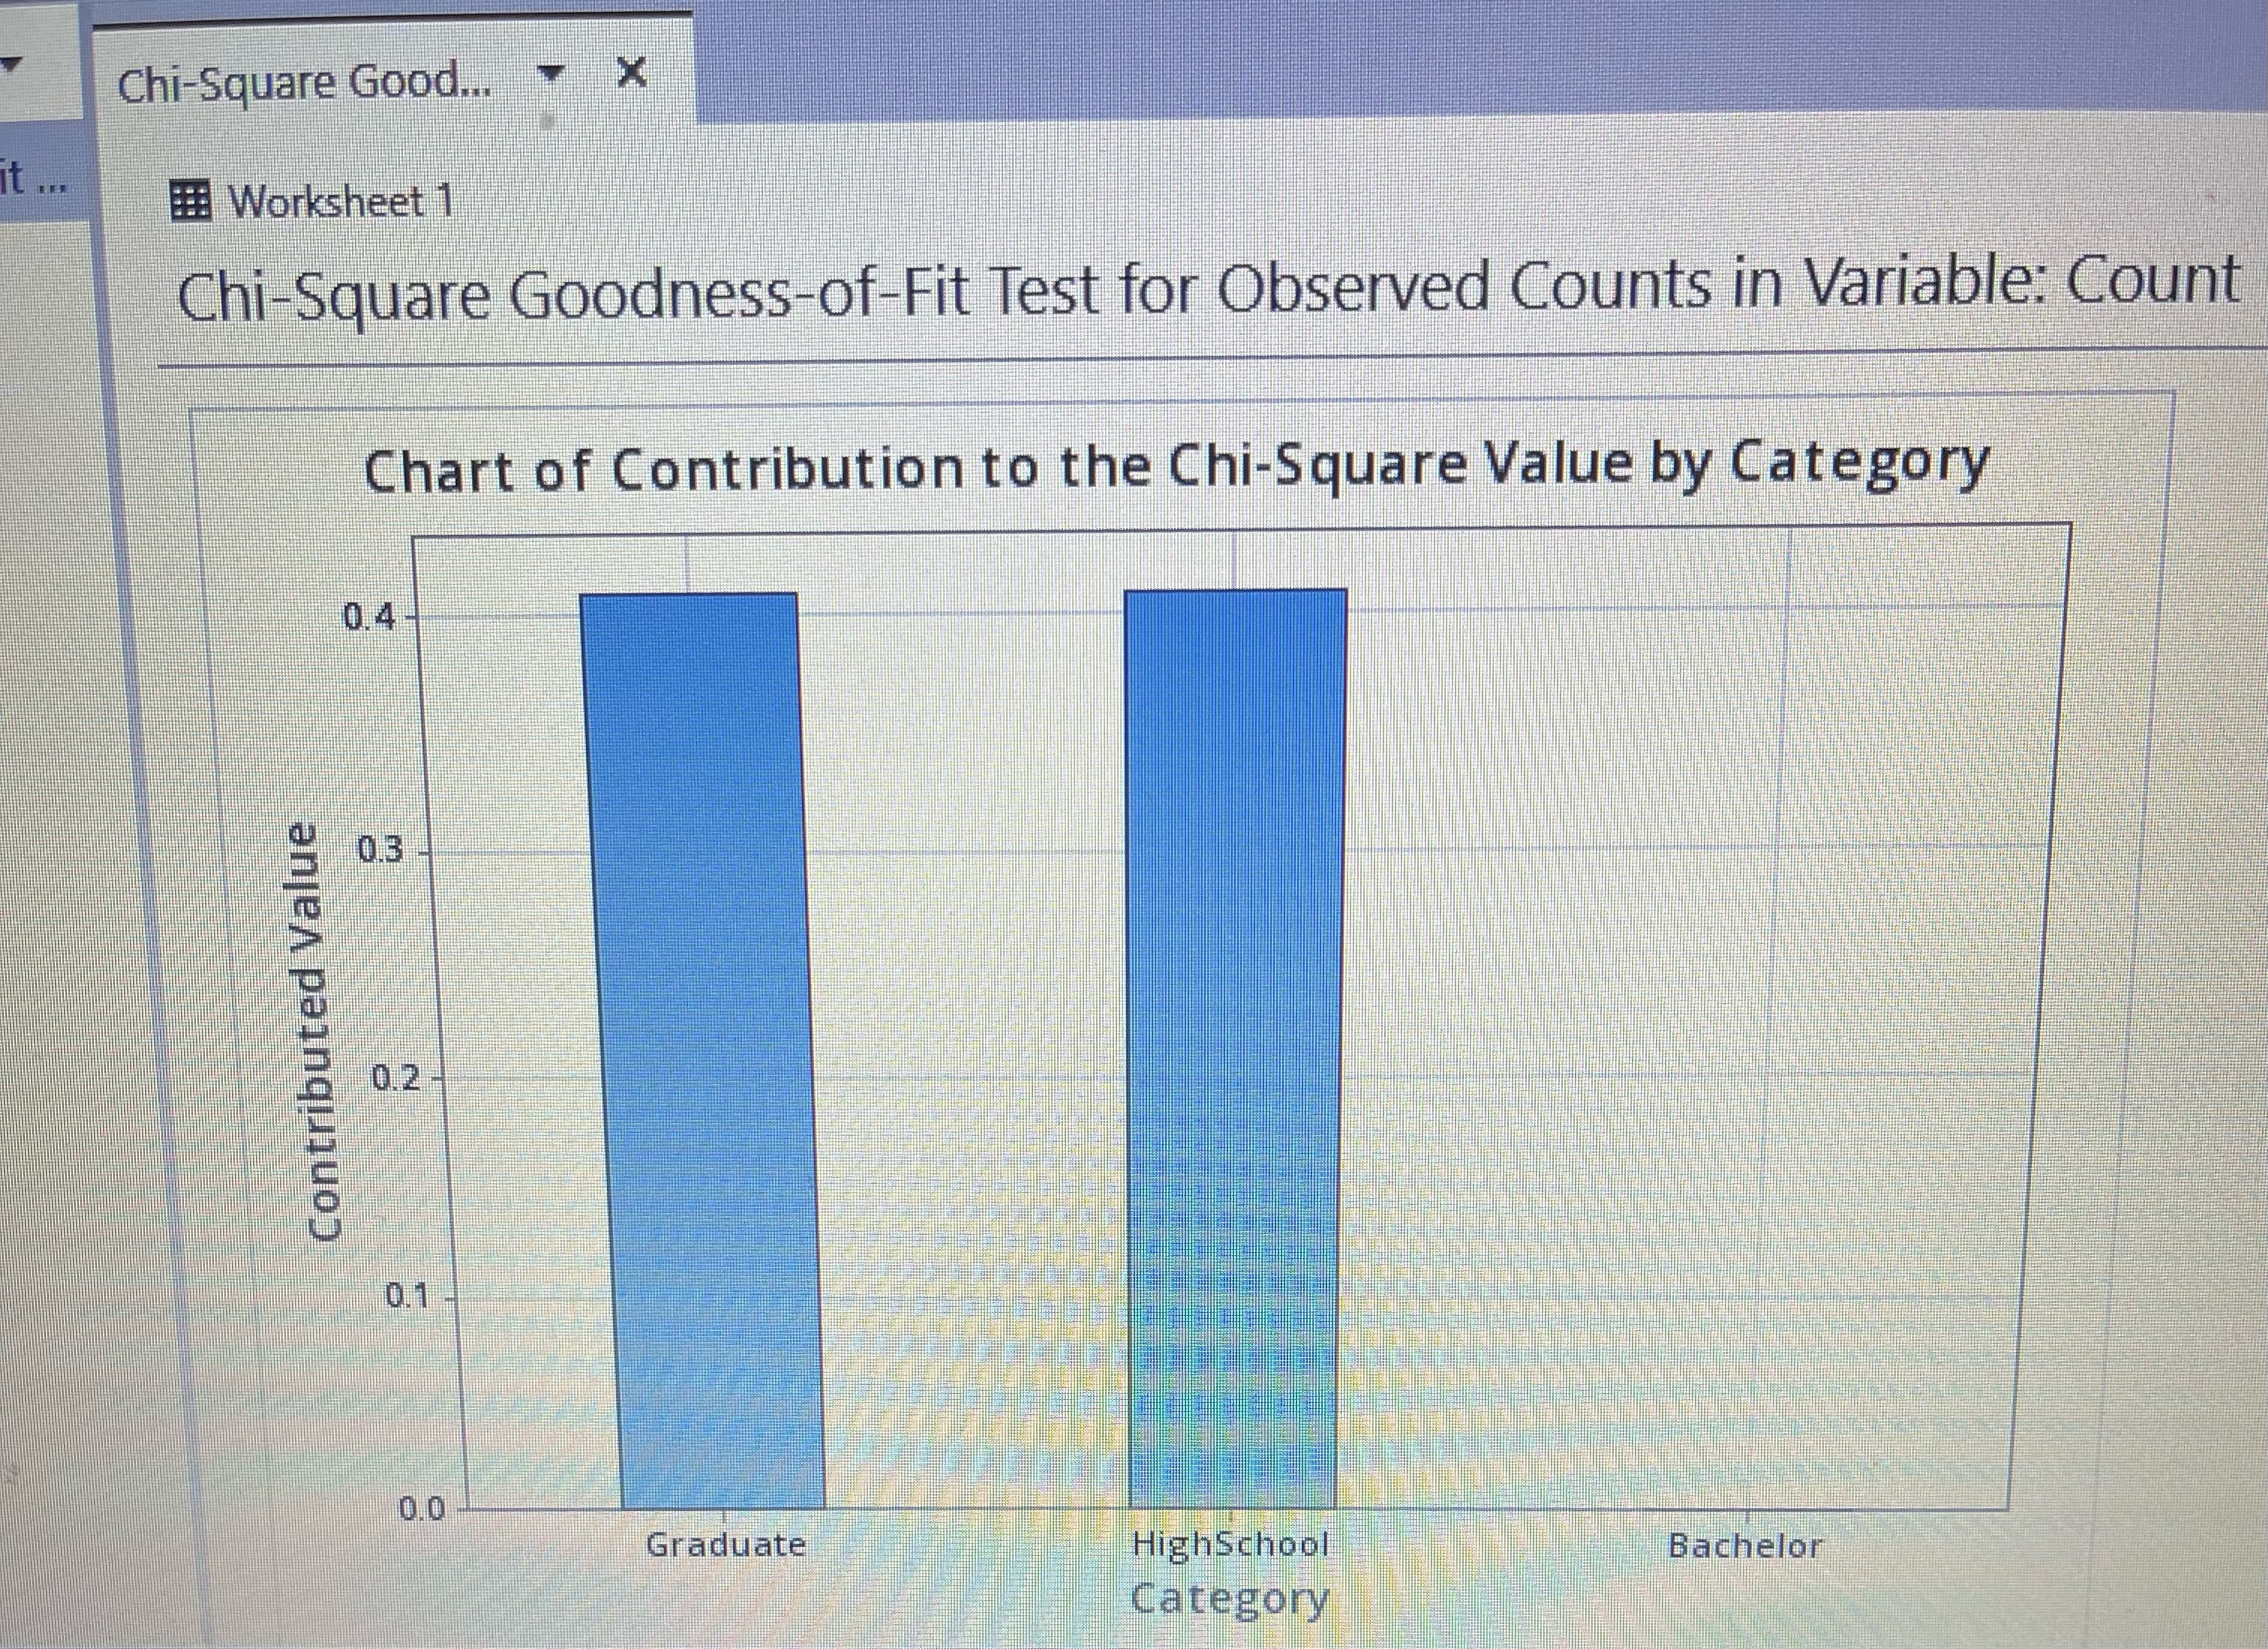
Using category names in Education Observed and Expected Counts Test Contribution Category Observed Proportion Expected to Chi-Square Bachelor 22 0.333333 22 0.000000 Graduate 19 0.333333 22 0.409091 HighSchool 25 0.333333 22 0.409091 Chi-Square Test N DF Chi-Sq P-Value 66 2 0.818182 0.664Chi-Square Good... ~ x Worksheet 1 Chi-Square Goodness-of-Fit Test for Observed Counts in Variable: Count Chart of Observed and Expected Values 25 Expected Observed 20 15 Value 10 5 Category Bachelor Graduate HighSchoolChi-Square Good. X it . Worksheet 1 Chi-Square Goodness-of-Fit Test for Observed Counts in Variable: Count Chart of Contribution to the Chi-Square Value by Category 0.4 0.3 Contributed Value 0.2 0.1 0.0 Graduate HighSchool Bachelor Category
Step by Step Solution
There are 3 Steps involved in it

Get step-by-step solutions from verified subject matter experts