Question: Using data from the both companies , compare their performances. In your analysis, explain which company you would prefer doing business from the perspective of
Using data from theboth companies, compare their performances. In your analysis, explain which company you would prefer doing business from the perspective of the following parties:
- An investor; and
- An inventory supplier.
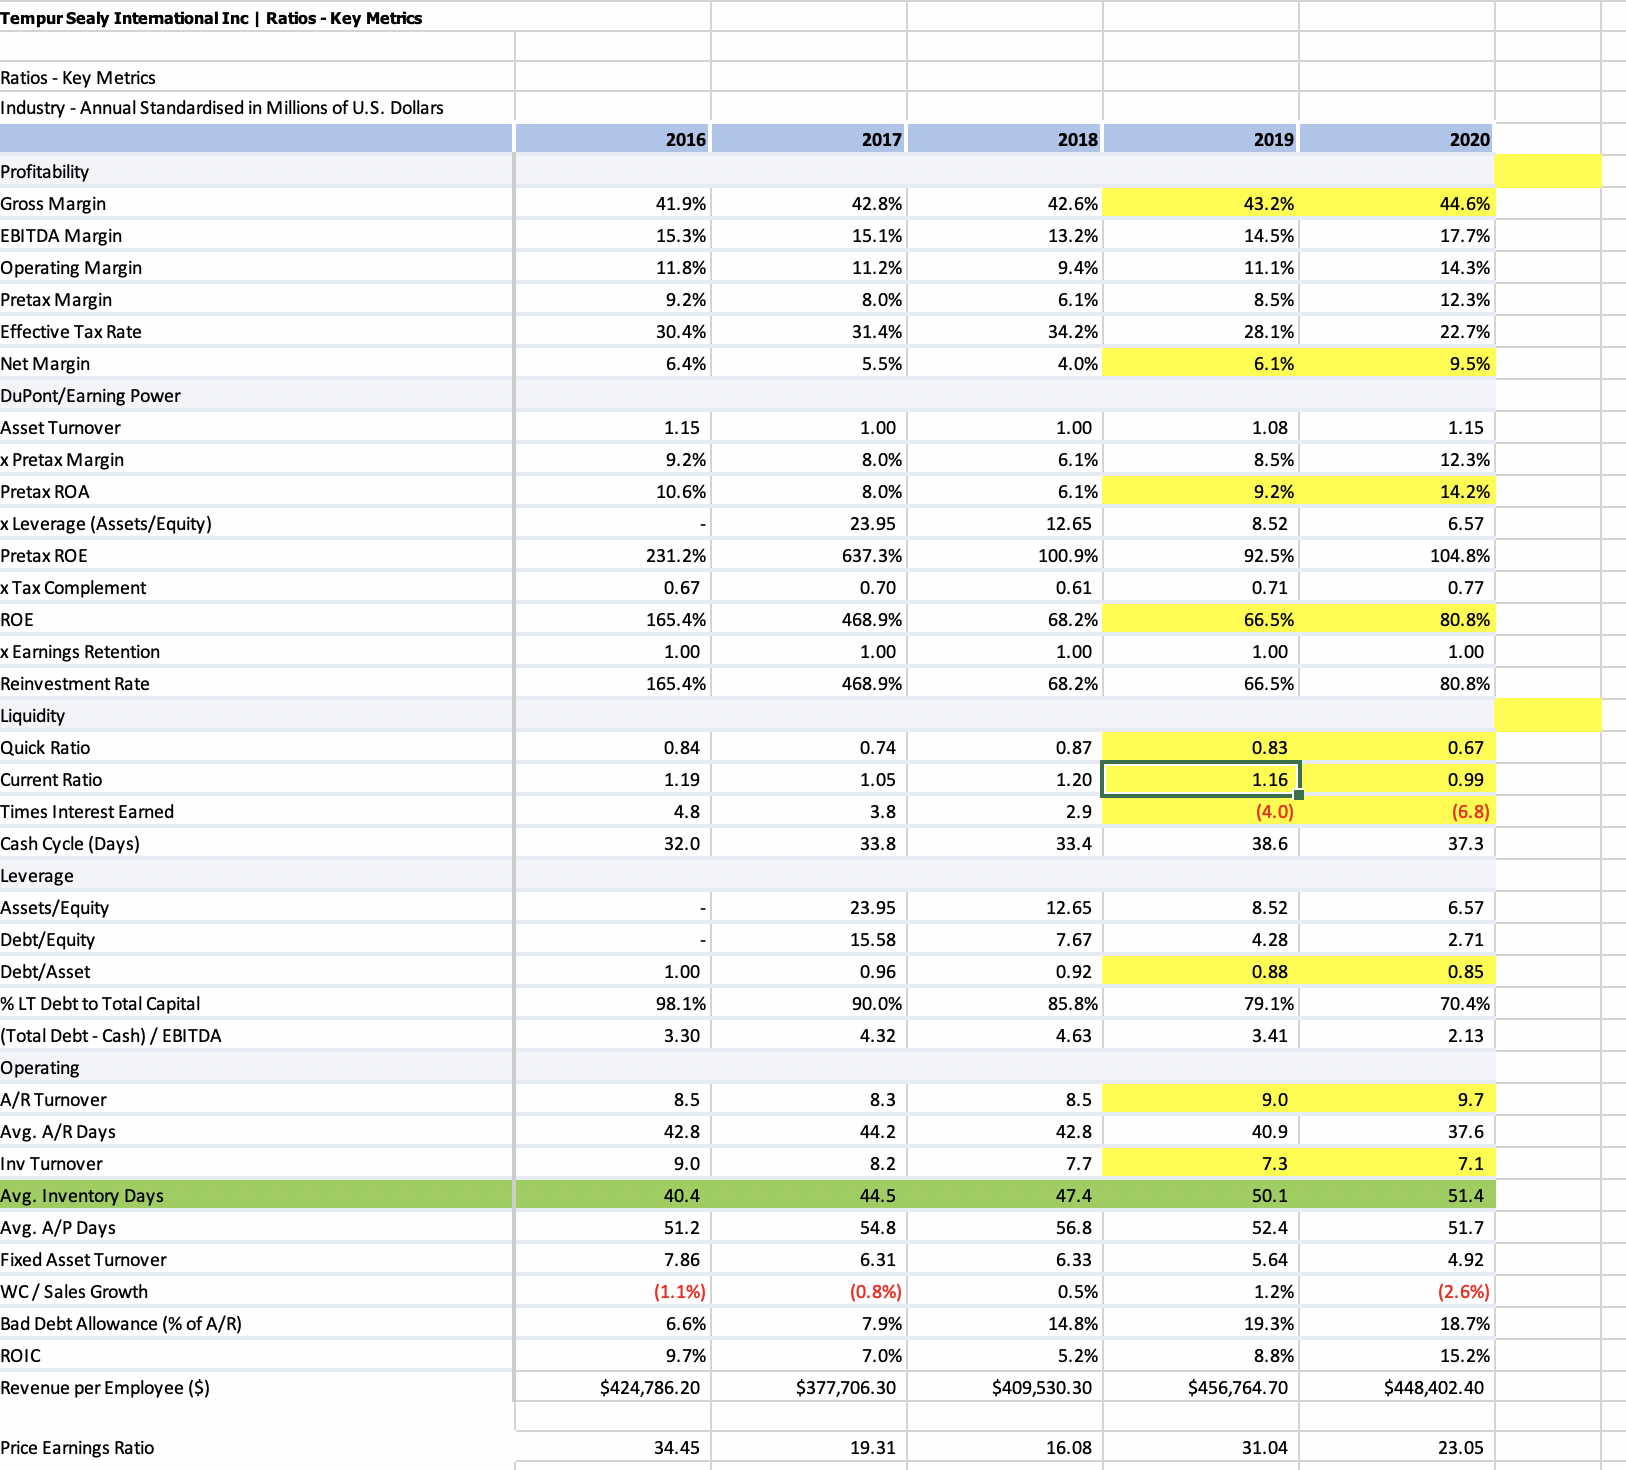
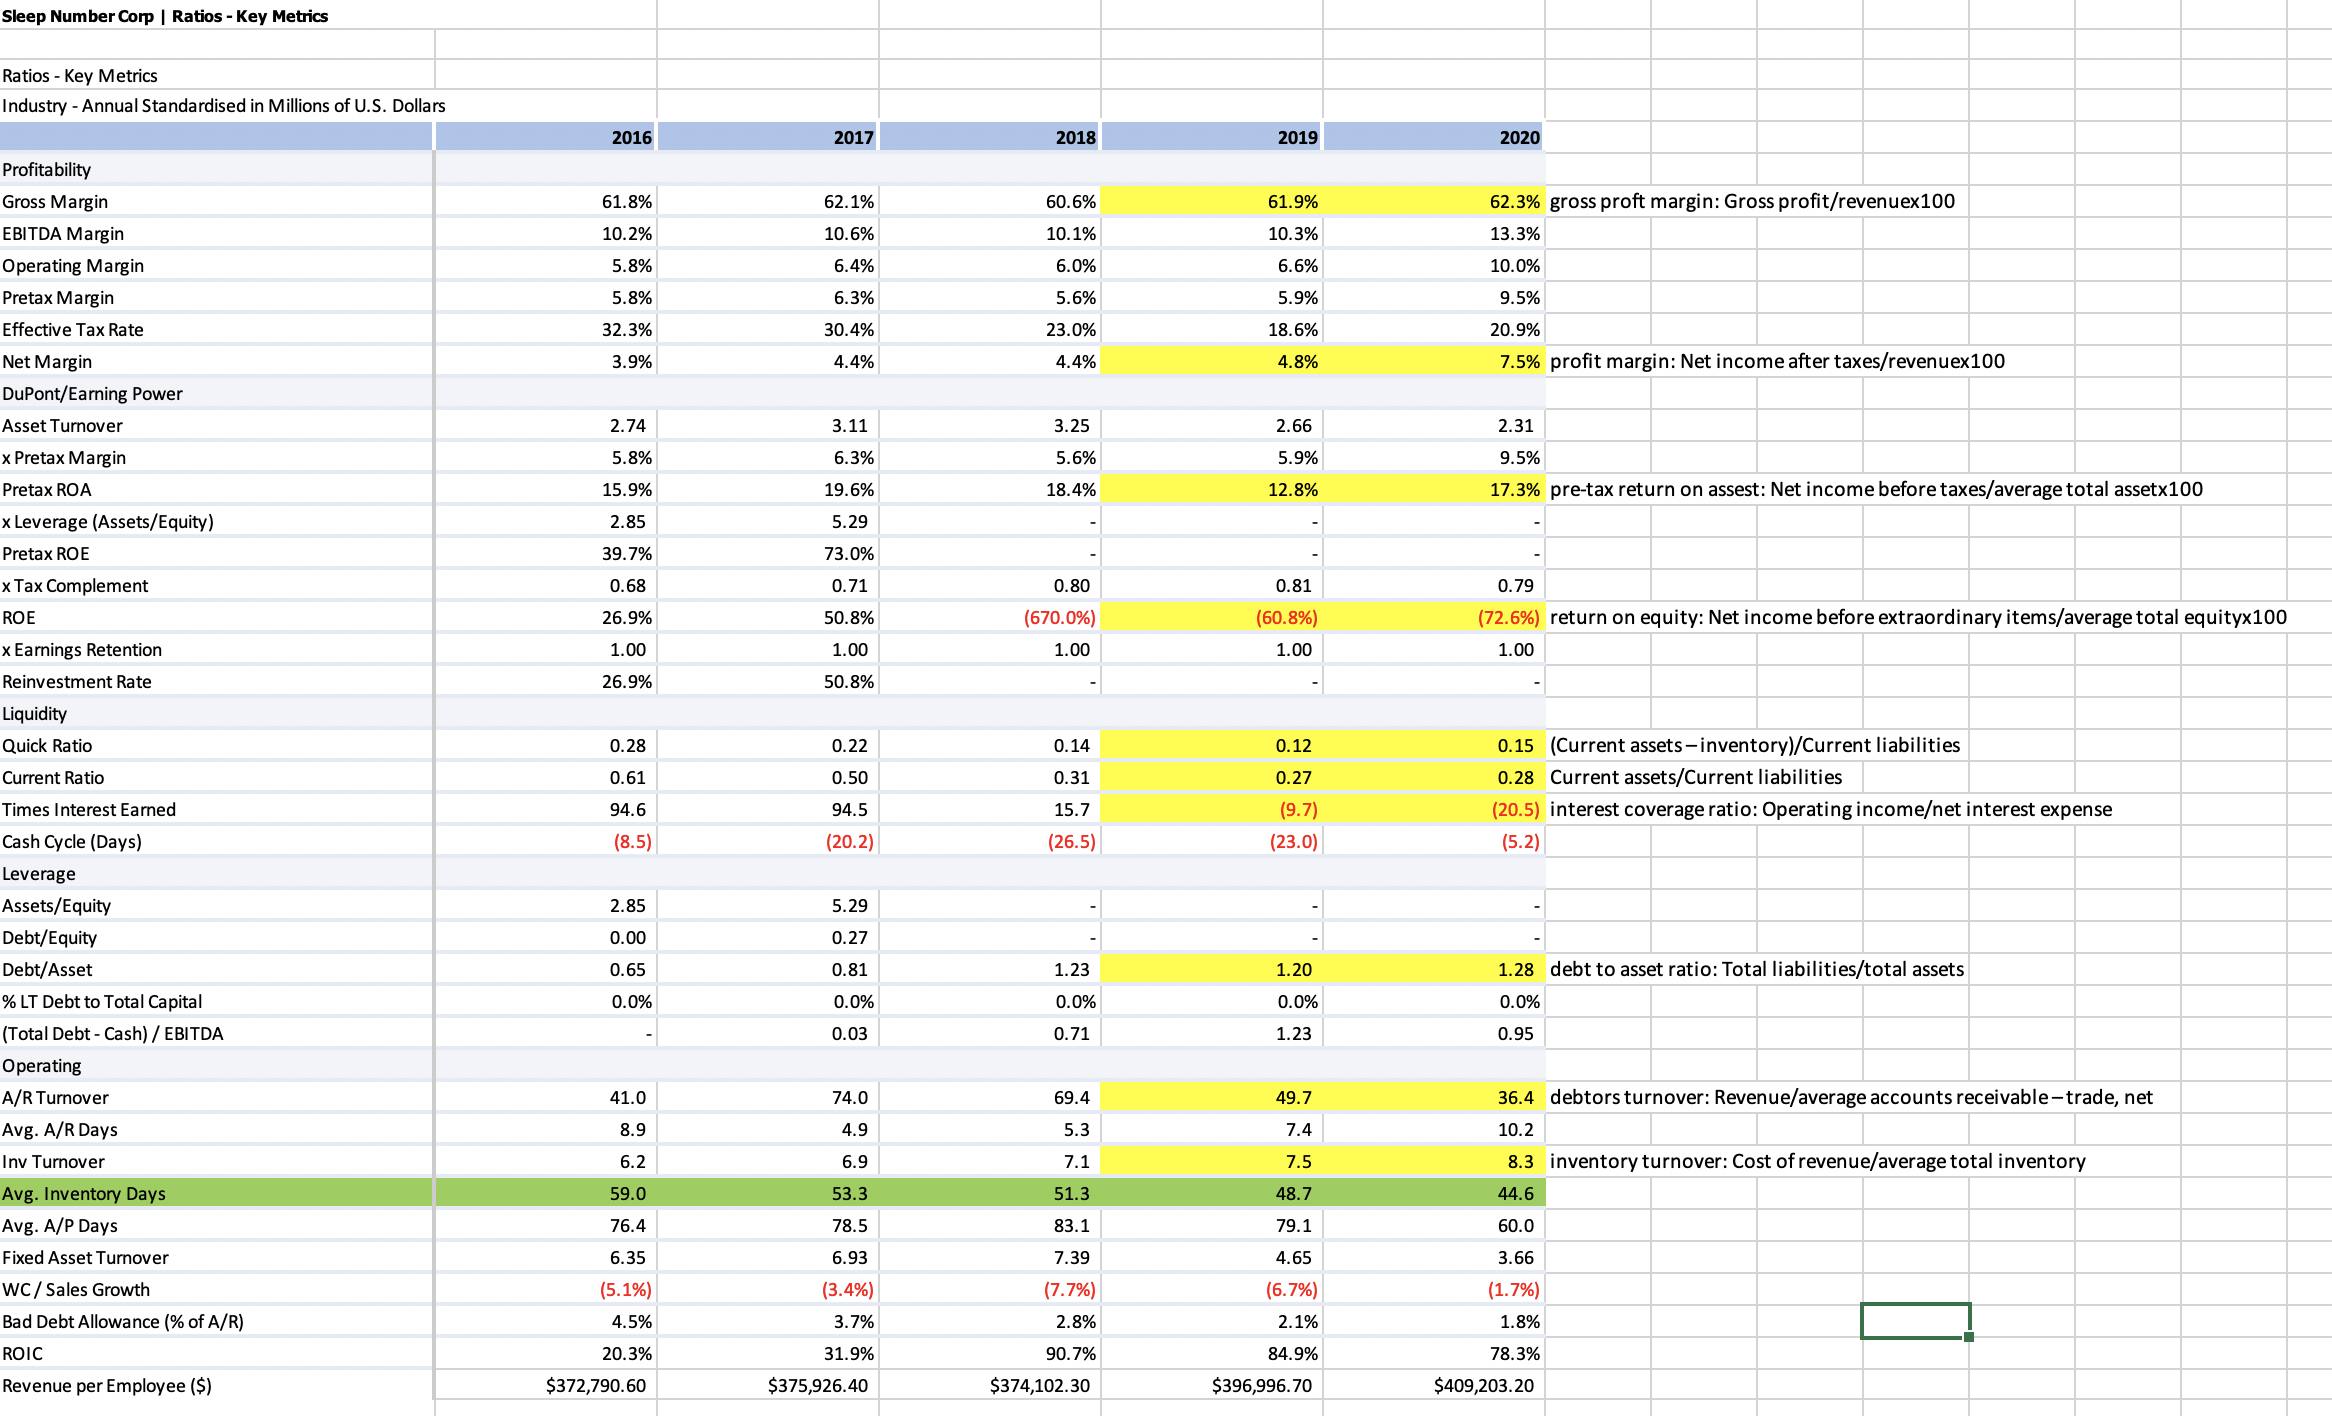
Tempur Sealy International Inc | Ratios - Key Metrics Ratios - Key Metrics Industry - Annual Standardised in Millions of U.S. Dollars 2016 2017 2018 2019 2020 Profitability Gross Margin 41.9% 42.8% 42.6% 43.2% 44.6% EBITDA Margin 15.3% 15.1% 13.2% 14.5% 17.7% Operating Margin 11.8% 11.2% 9.4% 11.1% 14.3% Pretax Margin 9.2% 8.0% 6.1% 8.5% 12.3% Effective Tax Rate 30.4% 31.4% 34.2% 28.1% 22.7% Net Margin 6.4% 5.5% 4.0% 6.1% 9.5% DuPont/Earning Power Asset Turnover 1.15 1.00 1.00 1.08 1.15 x Pretax Margin 9.2% 8.0% 6.1% 8.5% 2.3% Pretax ROA 10.6% 8.0% 6.1% 9.2% 4.2% x Leverage (Assets/Equity) 23.95 12.65 8.52 6.57 Pretax ROE 231.2% 637.3% 100.9% 2.5% 104.8% Tax Complement 0.67 0.70 0.61 0.71 0.77 ROE 165.4% 68.9% 58.2% 56.5% 80.8% x Earnings Retention 1.00 1.00 1.00 1.00 1.00 Reinvestment Rate 165.4% 468.9% 68.2% 66.5% 80.8% Liquidity Quick Ratio 0.84 0.74 0.87 0.83 0.67 Current Ratio 1.19 L. 05 1.20 1.16 0.99 Times Interest Earned 4 .8 3.8 2.9 (4.0) (6.8) Cash Cycle (Days 32.0 33.8 33.4 38.6 37.3 Leverage Assets/Equity 23.95 12.65 8.52 6.57 Debt/Equity 15.58 7.67 4.28 2.71 Debt/Asset 1.00 0.96 0.92 0.88 0.85 % LT Debt to Total Capital 98.1% 90.0% 35.8% 79.1% 70.4% (Total Debt - Cash) / EBITDA 3.30 4.32 4.63 3.41 2.13 Operating A/R Turnover 8.5 8.3 8.5 9.0 9.7 Avg. A/R Days 42.8 44.2 42.8 40.9 37.6 Inv Turnover 9.0 8.2 7. 7 7.3 7.1 47.4 50.1 Avg. Inventory Days 40.4 44.5 51.4 Avg. A/P Days 51.2 54.8 56.8 52.4 51.7 Fixed Asset Turnover 7.86 6.31 6.33 5.64 4.92 NC / Sales Growth (1.1%) 0.8%) 0.5% 1.2% (2.6%) Bad Debt Allowance (% of A/R) 6.6% 7.9% 14.8% 19.3% 18.7% ROIC 9.7% 7.0% 5.2% 8.8% 15.2% Revenue per Employee ($) $424,786.20 $377,706.30 $409,530.30 $456,764.70 $448,402.40 Price Earnings Ratio 34.45 19.31 16.08 31.04 23.05Sleep Number Corp | Ratios - Key Metrics Ratios - Key Metrics Industry - Annual Standardised in Millions of U.S. Dollars 2016 2017 2018 2019 2020 Profitability Gross Margin 61.8% 62.1% 60.6% 61.9% 62.3% gross proft margin: Gross profit/revenuex100 EBITDA Margin 10.2% 10.6% 10.1% 10.3% 13.3% Operating Margin 5.8% 5.4% 6.0% 6.6% 10.0% Pretax Margin 5.8% 5.3% 5.6% 5.9% 9.5% Effective Tax Rate 32.3% 30.4% 23.0% 18.6% 20.9% Net Margin 3.9% 1.4% 4.4% 4.8% 7.5% profit margin: Net income after taxes/revenuex100 DuPont/Earning Power 3.11 2.31 Asset Turnover 2.74 3.25 2.66 5.9% x Pretax Margin 5.8% 5.3% 5.6% 9.5% Pretax ROA 15.9% 19.6% 18.4% 12.8% 17.3% pre-tax return on assest: Net income before taxes/average total assetx100 x Leverage (Assets/Equity) 2.85 5.29 Pretax ROE 39.7% 73.0% x Tax Complement 0.68 0.71 0.80 0.81 0.79 26.9% 50.8% (670.0%) (72.6%) return on equity: Net income before extraordinary items/average total equityx100 ROE (60.8%) x Earnings Retention 1.00 1.00 1.00 1.00 1.00 Reinvestment Rate 26.9% 50.8% Liquidity Quick Ratio 0.28 0.22 0.14 0.12 0.15 (Current assets -inventory)/Current liabilities Current Ratio 0.61 0.50 0.31 0.27 0.28 Current assets/Current liabilities Times Interest Earned 94.6 94.5 15.7 (9.7) (20.5) interest coverage ratio: Operating incomeet interest expense Cash Cycle (Days) (8.5) (20.2) (26.5) (23.0) ( 5.2) Leverage Assets/Equity 2.85 5.29 Debt/Equity 0.00 0.27 Debt/Asset 0.65 0.81 1.23 1.20 1.28 debt to asset ratio: Total liabilities/total assets % LT Debt to Total Capital 0.0% 0.0% 0.0% 0.0% 0.0% (Total Debt - Cash) / EBITDA 0.03 0.71 1.23 0.95 Operating A/R Turnover 41.0 74.0 69.4 49.7 36.4 debtors turnover: Revenue/average accounts receivable-trade, net Avg. A/R Days 8.9 4.9 5.3 7.4 10.2 Inv Turnover 6.2 6.9 7.1 7.5 8.3 inventory turnover: Cost of revenue/average total inventory 48.7 Avg. Inventory Days 59.0 53.3 51.3 44.6 76.4 83.1 60.0 Avg. A/P Days 78.5 79.1 Fixed Asset Turnover 6.35 6.93 7.39 4.65 3.66 WC / Sales Growth (5.1%) (3.4%) 17.7%) (6.7%) (1.7% Bad Debt Allowance (% of A/R) 4.5% 3.79 2.8% 2.1% 1.8% ROIC 20.3% 31.9% 90.7% 84.9% 78.3% Revenue per Employee ($) $372,790.60 $375,926.40 $374,102.30 $396,996.70 $409,203.20