Question: Using data in the below in class example, forecast GA operations using effective buying income (X 2 ) as the independent variable. (I already put

Using data in the below in class example, forecast GA operations using effective buying income (X2) as the independent variable. (I already put the forecast in the table) questions in png:Using data in the below in class example,

Questions: How does this forecast differ from that using employment as the independent variable? What is the coefficient of determination for this scenario and what does it imply? GA Operations Employment X1 Effective Buying Income X2 Formula Y=2405+0.4227*X 2000 2001 2002 2003 2004 2005 2006 2007 2008 2009 2010 2015 2020 2030 22,513 23,768 21,838 25,904 26,208 26,946 27,977 27,294 28,647 29,270 30521.8458 33469.6457 37138.0714 44489.1984 45.714 48,601 51,314 54,107 57,848 56,022 56,317 58,757 61,556 62,341 66,533 73,491 82,189 99,584 8,433 9,207 10,106 10,457 11,055 11,016 11,399 11,883 12,119 12,213 13,081 14,609 16,525 20,369

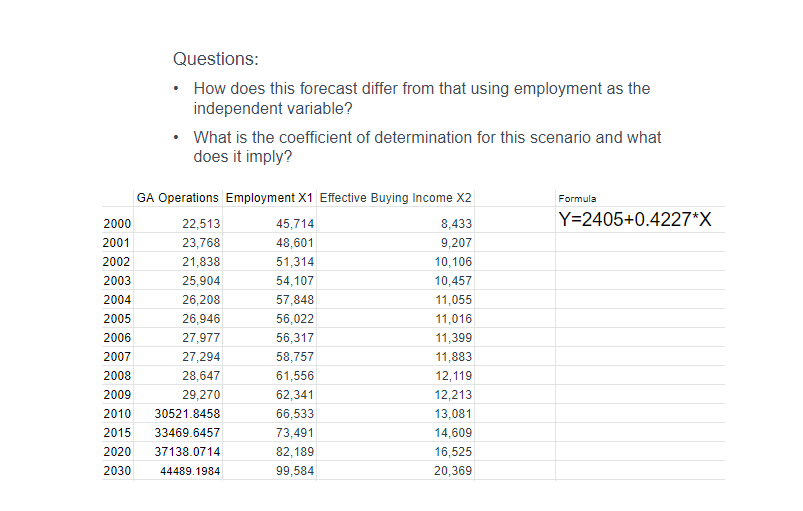
Step by Step Solution

There are 3 Steps involved in it

1 Expert Approved Answer
Step: 1 Unlock blur-text-image
Question Has Been Solved by an Expert!

Get step-by-step solutions from verified subject matter experts

Step: 2 Unlock
Step: 3 Unlock

Students Have Also Explored These Related General Management Questions!