

Question: Using data x, listed in below. Jo = 10 and 6 = 0.8. Xi Xi 9.45 16 9.37 7.99 17 10.62 9.29 18 10.31 11.66
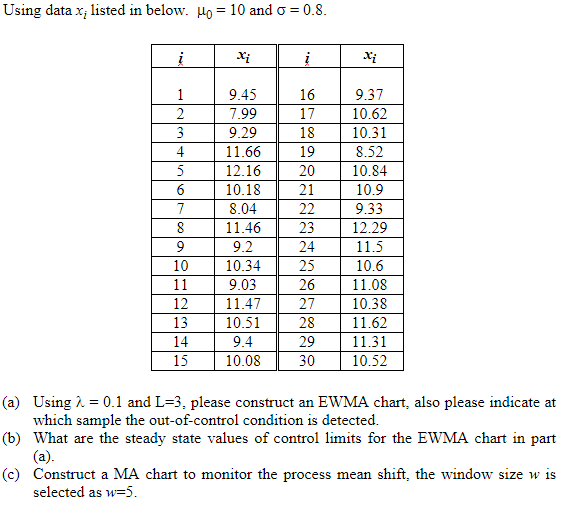
Using data x, listed in below. Jo = 10 and 6 = 0.8. Xi Xi 9.45 16 9.37 7.99 17 10.62 9.29 18 10.31 11.66 19 8.52 12.16 20 10.84 10.18 21 10.9 8.04 22 9.33 11.46 23 12.29 9.2 24 11.5 10 10.34 25 10.6 11 9.03 26 11.08 12 11.47 27 10.38 13 10.51 28 11.62 14 9.4 29 11.31 15 10.08 30 10.52 (a) Using A = 0.1 and L=3, please construct an EWMA chart, also please indicate at which sample the out-of-control condition is detected. (b) What are the steady state values of control limits for the EWMA chart in part (a). (c) Construct a MA chart to monitor the process mean shift, the window size w is selected as w=5
Step by Step Solution
There are 3 Steps involved in it
1 Expert Approved Answer
Step: 1 Unlock

Question Has Been Solved by an Expert!
Get step-by-step solutions from verified subject matter experts
Step: 2 Unlock
Step: 3 Unlock