

Question: Using EVIEWS Application, provide the simple non linear and non linear regression analysis on the data provided. - show the step-by-step process on how to
Using EVIEWS Application, provide the simple non linear and non linear regression analysis on the data provided.
- show the step-by-step process on how to do it on Eviews
- show and interpret the results of the standard error, probability, r-squared, adjusted r-squared.
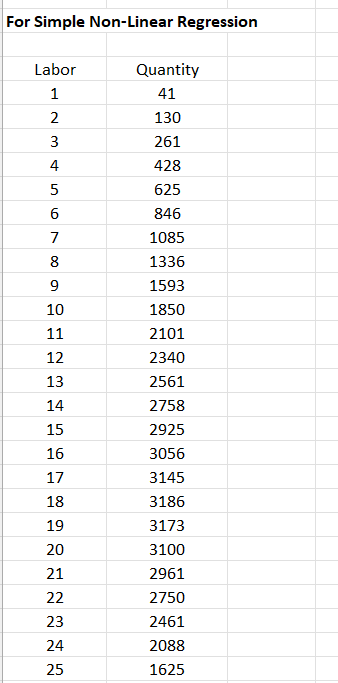
USE THE DATA PROVIDED BELOW
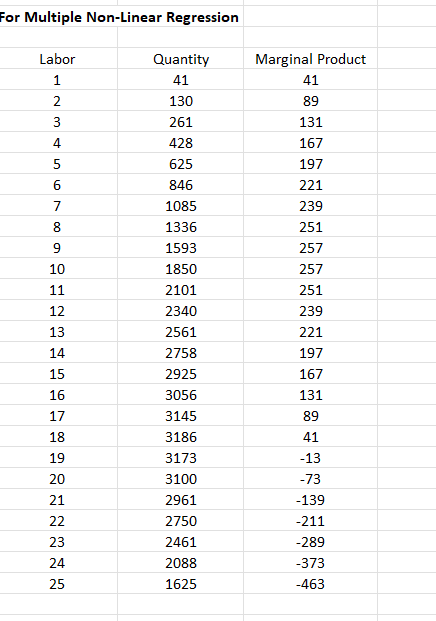
For Multiple Non-Linear Regression Labor Quantity Marginal Product 41 41 130 89 261 131 428 167 625 197 846 221 1085 239 8 1336 251 1593 257 10 1850 257 11 2101 251 12 2340 239 13 2561 221 14 2758 197 15 2925 167 16 3056 131 17 3145 89 18 3186 41 19 3173 -13 20 3100 -73 21 2961 -139 22 2750 -211 23 2461 -289 24 2088 -373 25 1625 -463
Step by Step Solution
There are 3 Steps involved in it
1 Expert Approved Answer
Step: 1 Unlock

Question Has Been Solved by an Expert!
Get step-by-step solutions from verified subject matter experts
Step: 2 Unlock
Step: 3 Unlock