

Question: Using Ex *Using Exhibits 24-1 and 24-3, calculate the long-term debt to stockholders equity, profit margin, and return on equity for 2018.* alance sheet and
 Using Ex
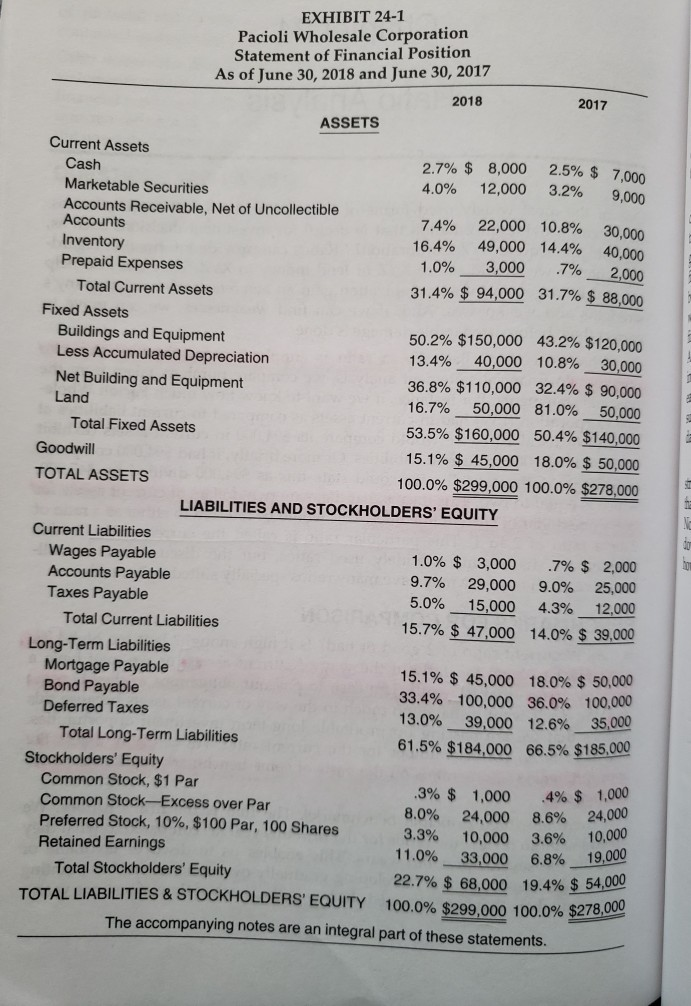
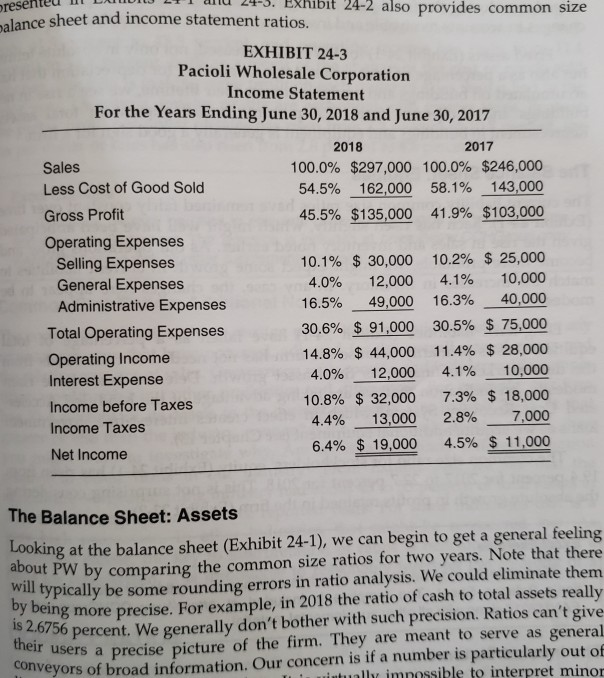
*Using Exhibits 24-1 and 24-3, calculate the long-term debt to stockholders equity, profit margin, and return on equity for 2018.*
alance sheet and income statement ratios. EXHIBIT 24-3 Pacioli Wholesale Corporation Income Statement For the Years Fndino Iune 20 T01R and Iuna 20 ont The Balance Sheet: Assets Looking at the balance sheet (Exhibit 24-1), we can begin to get a general feeling about PW by comparing the common size ratios for two years. Note that there will typically be some rounding errors in ratio analysis. We could eliminate them by being more precise. For example, in 2018 the ratio of cash to total assets really is 2.6756 percent. We generally don't bother with such precision. Ratios can't give their users a precise picture of the firm. They are meant to serve as general conveyors of broad information. Our concern is if a number is particularly out of EXHIBIT 24-1 Pacioli Wholesale Corporation Statement of Financial Position As of June 30, 2018 and June 30, 2017 ASSETS Current Assets Cash 2018 2017 Marketable Securities Accounts Receivable, Net of Uncollectible Accounts Inventory Prepaid Expenses Total Current Assets Fixed Assets Buildings and Equipment Less Accumulated Depreciation Net Building and Equipment Land Total Fixed Assets Goodwill TOTAL ASSETS \begin{tabular}{rrrr} 2.7% & $8,000 & 2.5% & $7,000 \\ 4.0% & 12,000 & 3.2% & 9,000 \\ 7.4% & 22,000 & 10.8% & 30,000 \\ 16.4% & 49,000 & 14.4% & 40,000 \\ 1.0% & 3,000 & .7% & 2,000 \\ 31.4% & $94,000 & 31.7% & $88,000 \\ \hline \end{tabular} 50.2%$150,00043.2%$120,000 13.4%40,00010.8%30,000 36.8%$110,00032.4%$90,000 16.7%50,00081.0%50,000 53.5%$160,00050.4%$140,000 15.1%$45,00018.0%$50,000 100.0%$299,000100.0%$278,000 LIABILITIES AND STOCKHOLDERS' EQUITY Current Liabilities Wages Payable Accounts Payable Taxes Payable Total Current Liabilities Long-Term Liabilities Mortgage Payable Bond Payable Deferred Taxes Total Long-Term Liabilities Stockholders' Equity Common Stock, \$1 Par Common Stock-Excess over Par Preferred Stock, 10\%, \$100 Par, 100 Shares Retained Earnings Total Stockholders' Equity TOTAL LIABILITIES \& STOCKHOLDERS' EQUITY 1.0%$3,000.7%$2,000 9.7%29,0009.0%25,000 5.0%15,0004.3%12,000 15.7%$47,00014.0%$39,000 15.1%$45,00018.0%$50,000 33.4%100,00036.0%100,000 13.0%39,00012.6%35,000 61.5%$184,00066.5%$185,000 \begin{tabular}{rrrr} .3% & $1,000 & .4% & $1,000 \\ 8.0% & 24,000 & 8.6% & 24,000 \\ 3.3% & 10,000 & 3.6% & 10,000 \\ 11.0% & 33,000 & 6.8% & 19,000 \\ 22.7% & $68,000 & 19.4% & $54,000 \\ \hline 00.0% & $299,000 & 100.0% & $278,000 \\ \hline \end{tabular} The accompanying notes are an integral part of these statements
Step by Step Solution
There are 3 Steps involved in it

Get step-by-step solutions from verified subject matter experts