

Question: Using Excel and the information below, prepare next year's operating budget for a 185-room full service hotel. Use 4 separate worksheets to create 3 individual
Using Excel and the information below, prepare next year's operating budget for a 185-room full service hotel. Use 4 separate worksheets to create 3 individual departmental budget schedules (Rooms, F&B and Admin) then a consolidated summary operating budget (like a summary operating statement that provides net operating income). The budget project is to be completed individually. The budget departmental schedules and summary operating budget statement must follow the proper USALI format.
workbook must contain 4 properly named worksheets in this order: (1) Summary Operating budget, (2) Rooms budget, (3) F&B budget and the (4) Administration Budget (which has no revenues).
Rooms Department information:
Revenues: Occupancy is expected to be 69.5% next year. ADR for transient rooms sold is expected @ $144.55 and Group rooms are expected to have an ADR of $138.50. The typical room sales mix is 70% transient and 30% Groups
Expenses (Payroll): There are four lines to budget for here.
1. The front office payroll is usually 7.5% of room revenues.
2. Fixed housekeeping wages represent 4.5% of room revenues
3. Room attendant wages (average wage is 17.00/ hour, attendants clean a room in 30 minutes)
4. Rooms staff benefits represent 10% of total rooms dept. payroll.
Other Rooms Department Expenses:
1. Guest Comfort (amenities) $10.25 CPOR
2. Laundry & Linen $10.55 CPOR
3. Training 2.75% of rooms revenue
Food & Beverage Department information:
Food Revenues:
1. The dining room: 75% of forecasted dining room food revenues are based on average food sales of $23.75 per room night. The remainder comes from outside guests, not staying at the hotel. (this amount is intentionally left out; you have enough information to figure out the extra 25%)
2. Rooms Service: Room service food revenues (not including beverage sales) are estimated at $8 per room night.
Beverage Revenues:
1.The minibar: Minibar revenues average out to $2.50 per room night
2. The bar: Bar revenues typically represent 30% of total food revenues
Cost of Sales:
1. Food Cost 33.5%
2. Beverage Costs 39.75%
Payroll:
1. Staff payroll represents 18.5% of F&B revenues
2. Benefits are 10% of staff payroll costs
Other expenses:
1. China & Glassware is 3.75% of F&B revenues
2. Laundry is 2. 5% of F&B revenues
3. Training is 5.65% of F&B revenues
Administration & General Department information: (no revenues just expenses)
Payroll:
1. General Manager's Office 2. 5% of total revenues
2. Department Heads 5.15% of total revenues
3. Benefits 10% of administration's payroll costs
Other Expenses:
1. Management travel and training 4% of total administration payroll 2. Uniforms 0.35% of total revenues
3. Sales & Marketing 8.15% of total revenues
4. Printing & Stationary 0.25% of total revenues
5. Bank Charges 0.65% of total revenues
6. Cleaning Materials 2.75% of total revenues
7. Contract Maintenance 2.15% of total revenues
EXAMPLE FORM
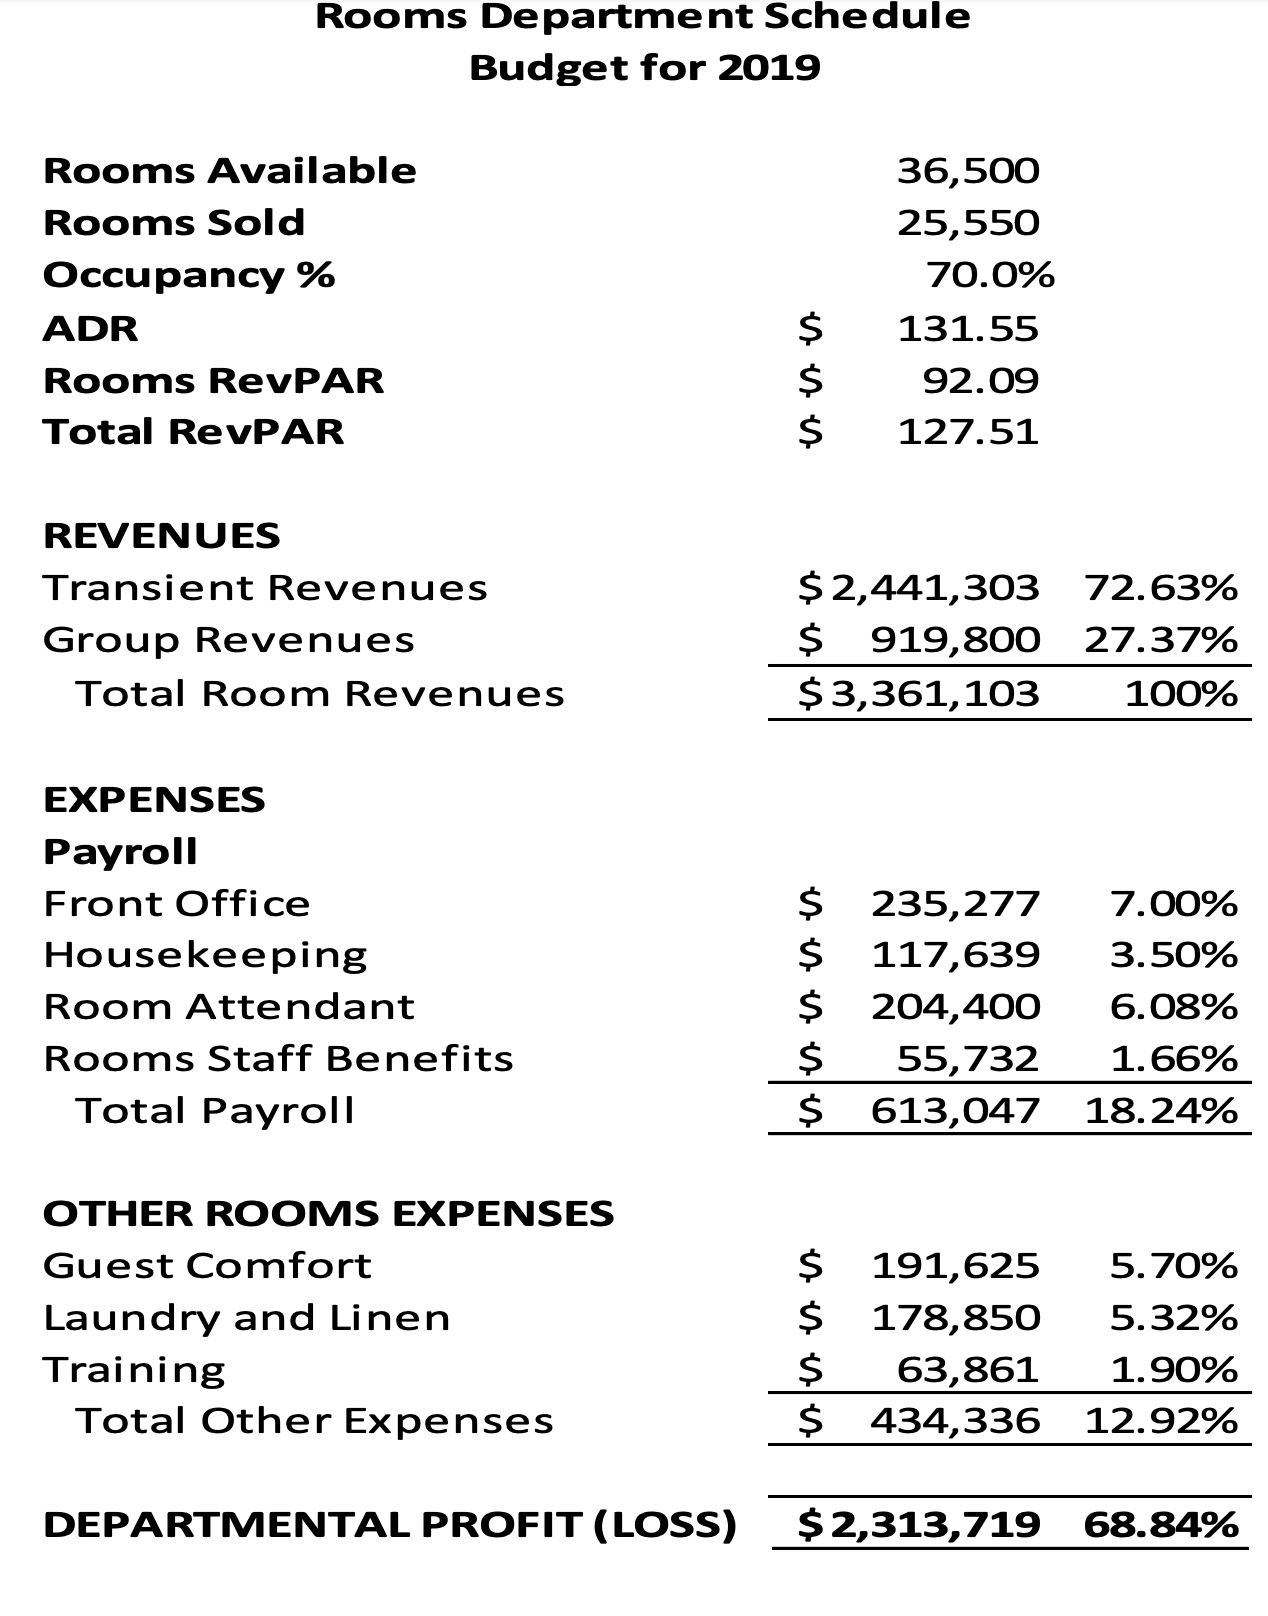
Rooms Department Schedule Budget for 2019 Rooms Available Rooms Sold Occupancy % ADR Rooms RevPAR Total RevPAR 36,500 25,550 70.0% $ 131.55 $ 92.09 $ 127.51 REVENUES Transient Revenues Group Revenues Total Room Revenues EXPENSES Payroll $2,441,303 72.63% $ 919,800 27.37% $3,361,103 100% Front Office $ 235,277 7.00% Housekeeping $ 117,639 3.50% Room Attendant $ 204,400 6.08% Rooms Staff Benefits $ 55,732 1.66% Total Payroll $ 613,047 18.24% OTHER ROOMS EXPENSES Guest Comfort $ 191,625 5.70% Laundry and Linen $ 178,850 5.32% Training $ 63,861 1.90% Total Other Expenses $ 434,336 12.92% DEPARTMENTAL PROFIT (LOSS) $2,313,719 68.84%
Step by Step Solution
There are 3 Steps involved in it

Get step-by-step solutions from verified subject matter experts