

Question: Using Excel, Chart possible outcomes to reflect a visualization and breakeven point of the analysis. 7. Stones Throw Hospital has a large demand for occupational
Using Excel, Chart possible outcomes to reflect a visualization and breakeven point of the analysis.
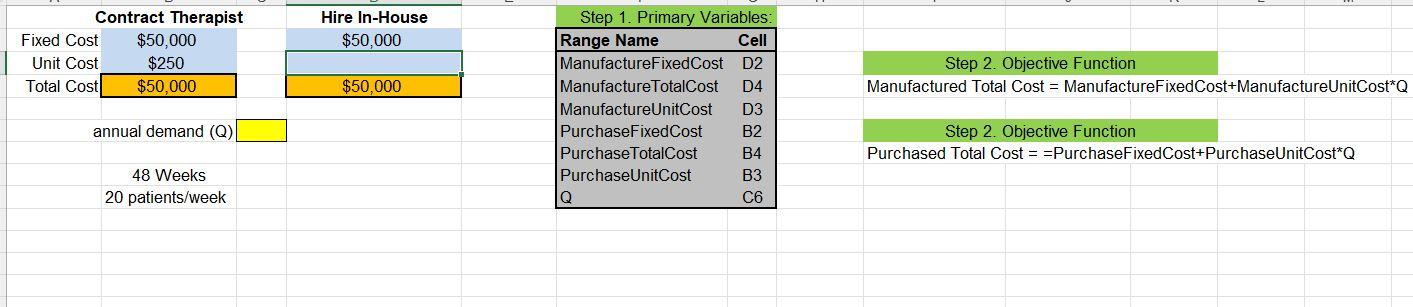
7. Stones Throw Hospital has a large demand for occupational therapists. The annual demand requires that the therapist see 20 patients a week for 48 weeks a year to keep up with the demand. The human resources manager has determined that they could hire a therapist that would make $200 for each therapy given to each patient. Furthermore, the hospital would have to generate a benefits package that would cost them $50,000 to hire the therapist. The HR manager also knows that she can work with a local contracting therapy company that would provide therapy for the demand of patients for $250/each patient, plus a contract/administration fee for $5,000.
A) What is the total cost to contract the therapy from a local company?
B) What is the total cost to provide in-house therapy?
C) What is your decision make or buy? Why?
D) Using Excel, Chart possible outcomes to reflect a visualization and breakeven point of the analysis.
This is what I have so far (Not sure if the values I entered are correct):
Step by Step Solution
There are 3 Steps involved in it

Get step-by-step solutions from verified subject matter experts