

Question: Using excel , compute the expected return and standard deviation for this portfolio by completing the below table. Assume a risk-free rate of 0.25%. Closing
Using excel, compute the expected return and standard deviation for this portfolio by completing the below table.
Assume a risk-free rate of 0.25%.
Closing price stock 1
20.440001
18.84
16.799999
17.23
17.15
17.389999
18
18
18.200001
17.700001
17.719999
17.83
Closing price stock 2
22.02
19.299999
16.370001
16.01
16.120001
16.110001
16.1
18.4
17.700001
17.200001
18.5
18.68
Compute the stocks average return, variance, and standard deviation using historical data -
and then Compute the expected return and standard deviation for this portfolio ( of both stocks)using the weight invested. the Portfolio contains the risk-free asset. Assume a risk-free rate of 0.25%.
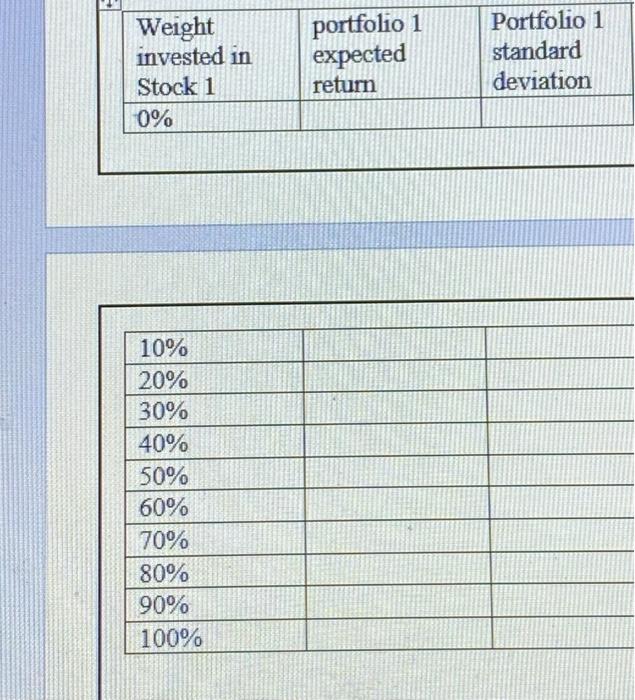
Weight invested in Stock 1 0% portfolio 1 expected return Portfolio 1 standard deviation 10% 20% 30% 40% 50% 60% 70% 80% 90% 100%
Step by Step Solution
There are 3 Steps involved in it
1 Expert Approved Answer
Step: 1 Unlock

Question Has Been Solved by an Expert!
Get step-by-step solutions from verified subject matter experts
Step: 2 Unlock
Step: 3 Unlock