

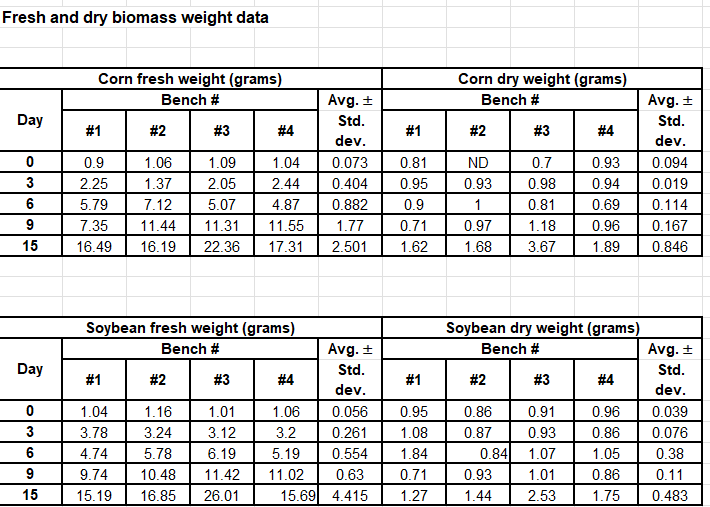
Question: using excel, make a scatterplot that depicts the average ( pm standard deviation ) fresh and dry weights ( Y axis, dependent variable, grams
using excel, make a scatterplot that depicts the average pm standard deviation fresh and dry weights Y axis, dependent variable, grams against time after planting X axis, independent variable, days for both plant species. These graphs must be formatted as Figures, with descriptive captions below each
that highlight what the data represent details of the experiment plus identification and interpretation the major trends. label the axis but no title.Fresh and dry biomass weight data
Step by Step Solution
There are 3 Steps involved in it
1 Expert Approved Answer
Step: 1 Unlock

Question Has Been Solved by an Expert!
Get step-by-step solutions from verified subject matter experts
Step: 2 Unlock
Step: 3 Unlock