

Question: Using Excel MONTHLY Expected Returns, Standard Deviations, and Correlations July 1 9 9 0 through December 2 0 1 4 , 2 9 4 months,
Using Excel
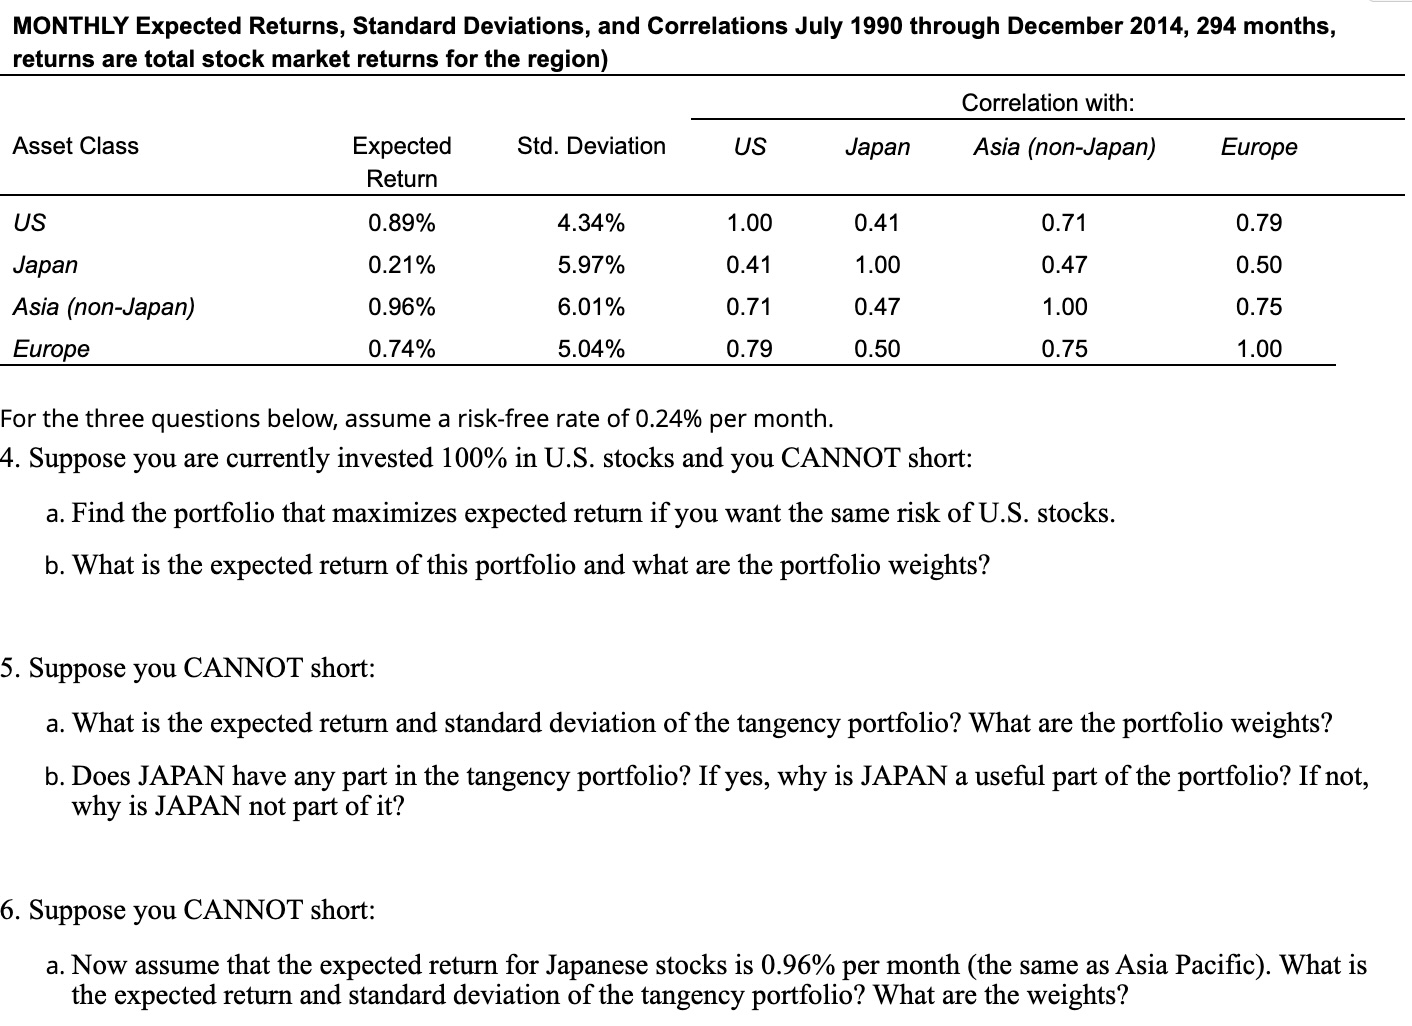
MONTHLY Expected Returns, Standard Deviations, and Correlations July through December months, returns are total stock market returns for the region
For the three questions below, assume a riskfree rate of per month.
Suppose you are currently invested in US stocks and you CANNOT short:
a Find the portfolio that maximizes expected return if you want the same risk of US stocks.
b What is the expected return of this portfolio and what are the portfolio weights?
Suppose you CANNOT short:
a What is the expected return and standard deviation of the tangency portfolio? What are the portfolio weights?
b Does JAPAN have any part in the tangency portfolio? If yes, why is JAPAN a useful part of the portfolio? If not, why is JAPAN not part of it
Suppose you CANNOT short:
a Now assume that the expected return for Japanese stocks is per month the same as Asia Pacific What is the expected return and standard deviation of the tangency portfolio? What are the weights?
Step by Step Solution
There are 3 Steps involved in it
1 Expert Approved Answer
Step: 1 Unlock

Question Has Been Solved by an Expert!
Get step-by-step solutions from verified subject matter experts
Step: 2 Unlock
Step: 3 Unlock