

Question: Using excel PROBLEM 1: ANALYSIS OF FINANCIAL RATIOS USING EXCEL ABC's ratios Vs. Industry Ratio Analysis ratios 2019 ABC's Industry Ratios 2020 ABC's ratios 2020
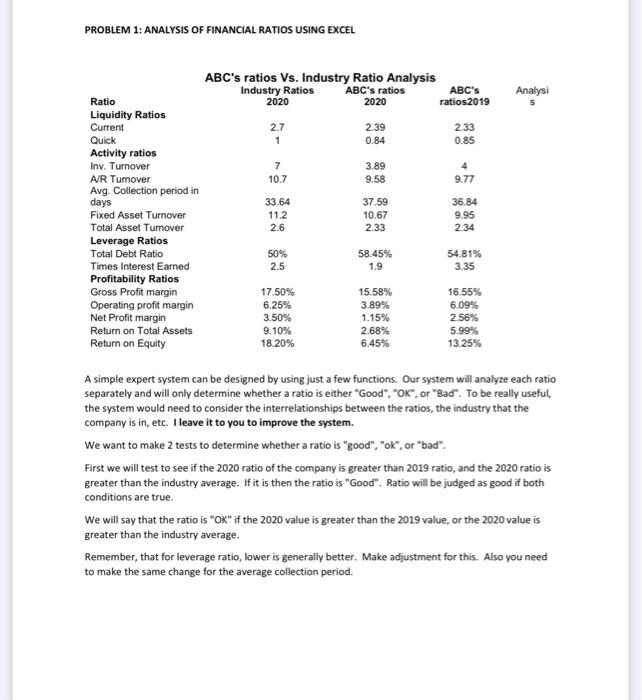
PROBLEM 1: ANALYSIS OF FINANCIAL RATIOS USING EXCEL ABC's ratios Vs. Industry Ratio Analysis ratios 2019 ABC's Industry Ratios 2020 ABC's ratios 2020 Analysi 2.7 1 2.39 0.84 233 0.85 7 10.7 3.89 9.58 4 9.77 Ratio Liquidity Ratios Current Quick Activity ratios Inv. Turnover AJR Turnover Avg. Collection period in days Fixed Asset Turnover Total Asset Tumover Leverage Ratios Total Debt Ratio Times Interest Earned Profitability Ratios Gross Profit margin Operating profit margin Net Profit margin Return on Total Assets Return on Equity 33.64 11.2 2.6 37.59 10.67 2.33 36.84 9.95 234 50% 58.45% 1.9 54.81% 3.35 2.5 17.50% 6.25% 3.50% 9.10% 18.20% 15.58% 3.89% 1.15% 2.68% 6.45% 16.55% 6.09% 2.56% 5.99% 13.25% A simple expert system can be designed by using just a few functions. Our system will analyze each ratio separately and will only determine whether a ratio is either "Good", "OK", or "Bad". To be really useful, the system would need to consider the interrelationships between the ratios, the industry that the company is in, etc. I leave it to you to improve the system. We want to make 2 tests to determine whether a ratio is "good","ok", or "bad". First we will test to see if the 2020 ratio of the company is greater than 2019 ratio, and the 2020 ratio is greater than the industry average. If it is then the ratio is "Good". Ratio will be judged as good if both conditions are true. We will say that the ratio is "OK" if the 2020 value is greater than the 2019 value, or the 2020 value is greater than the industry average. Remember, that for leverage ratio, lower is generally better. Make adjustment for this. Also you need to make the same change for the average collection period
Step by Step Solution
There are 3 Steps involved in it

Get step-by-step solutions from verified subject matter experts