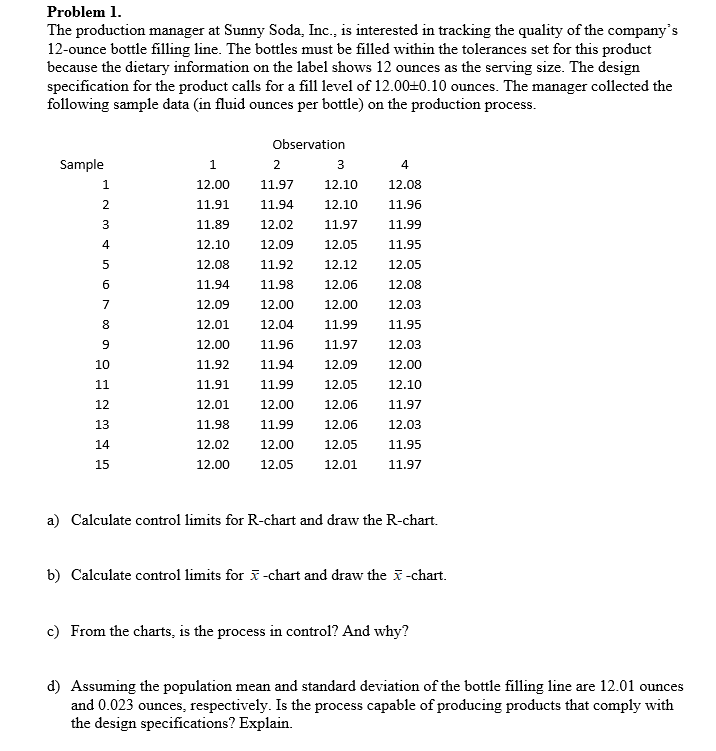
Question: Using Excel Problem 1. The production manager at Sunny Soda, Inc., is interested in tracking the quality of the company's 12-ounce bottle filling line. The

Using Excel

Using Excel Problem 1. The production manager at

Problem 1. The production manager at Sunny Soda, Inc., is interested in tracking the quality of the company's 12-ounce bottle filling line. The bottles must be filled within the tolerances set for this product because the dietary information on the label shows 12 ounces as the serving size. The design specification for the product calls for a fill level of 12.00+0.10 ounces. The manager collected the following sample data (in fluid ounces per bottle) on the production process. Sample 1 2 4 12.08 1 12.00 11.91 11.89 Observation 2 3 11.97 12.10 11.94 12.10 12.02 11.97 12.09 12.05 11.92 12.12 11.98 12.06 11.96 11.99 3 4 12.10 11.95 5 12.08 12.05 6 11.94 7 12.00 12.04 12.00 11.99 12.08 12.03 11.95 8 9 11.96 11.97 12.03 12.09 12.01 12.00 11.92 11.91 12.01 10 12.09 12.00 11.94 11.99 11 12.10 11.97 12 12.00 12.05 12.06 12.06 12.05 13 11.98 14 15 12.02 12.00 11.99 12.00 12.05 12.03 11.95 11.97 12.01 a) Calculate control limits for R-chart and draw the R-chart. b) Calculate control limits for -chart and draw the # -chart. c) From the charts, is the process in control? And why? d) Assuming the population mean and standard deviation of the bottle filling line are 12.01 ounce and 0.023 ounces, respectively. Is the process capable of producing products that comply with the design specifications? Explain

Step by Step Solution

There are 3 Steps involved in it

1 Expert Approved Answer
Step: 1 Unlock blur-text-image
Question Has Been Solved by an Expert!

Get step-by-step solutions from verified subject matter experts

Step: 2 Unlock
Step: 3 Unlock

Students Have Also Explored These Related General Management Questions!