

Question: Using Excel template of a 100m dash. The data are plotted as the acceleration over each 10m increment of the race (i.e., 0m to 10m,
Using Excel template of a 100m dash. The data are plotted as the acceleration over each 10m increment of the race (i.e., 0m to 10m, 10m to 20m, 20m to 30m, etc.). Based on these data, answer the following (10 points each):
- Describe the general slopes of each split of the graph. Where is acceleration largest?
- What do the negative acceleration values mean?
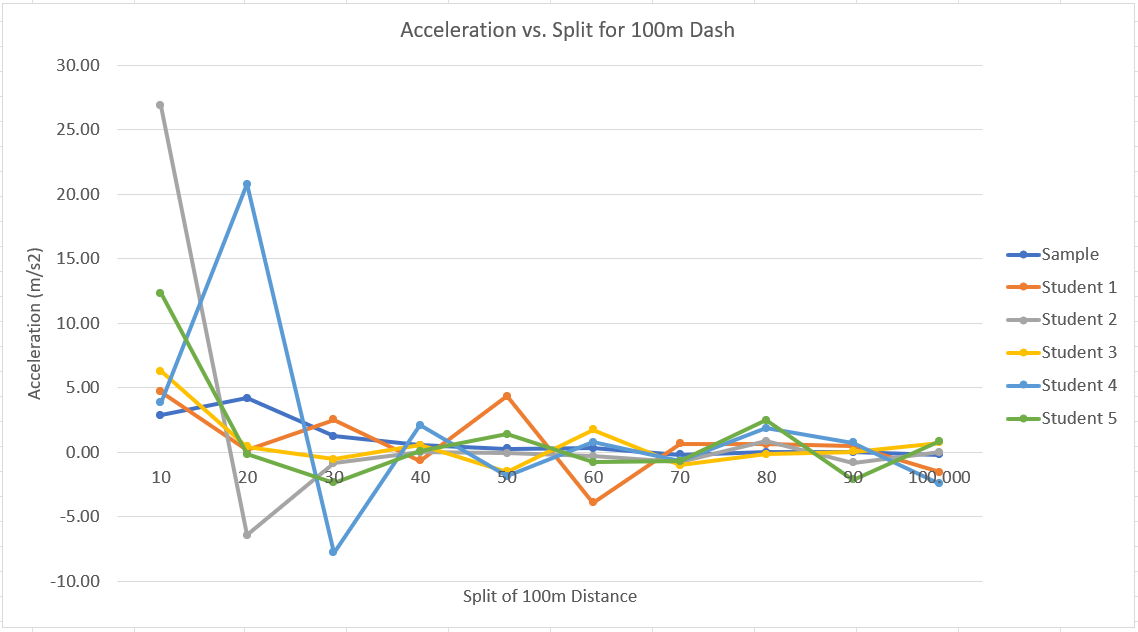
Acceleration (m/s2) 30.00 Acceleration vs. Split for 100m Dash 25.00 20.00 15.00 10.00 5.00 0.00 10 20 40 50 60 70 80 90 100,000 -5.00 -10.00 Split of 100m Distance -Sample -Student 1 -Student 2 -Student 3 -Student 4 -Student 5
Step by Step Solution
There are 3 Steps involved in it
1 Expert Approved Answer
Step: 1 Unlock

Question Has Been Solved by an Expert!
Get step-by-step solutions from verified subject matter experts
Step: 2 Unlock
Step: 3 Unlock