

Question: Required (a) Using the data given in the table above, use MS Excel to: (i) Prepare a schedule to be presented to management. The schedule
Required
(a) Using the data given in the table above, use MS Excel to:
(i) Prepare a schedule to be presented to management. The schedule must show the following for 5000, 10000, 15000, 20000, 25000 and 30000 kilometres per year:
(1) Total variable cost
(2) Total fixed cost
(3) Total cost
(4) Variable cost per kilometre
(5) Fixed cost per kilometre
(6) Total cost per kilometre
(ii) Plot on a graph (in Excel) the information given in your answer to (i) above for the costs listed in (1), (2), (3) and (6).
(iii) Show (using the graphs in (ii)) approximate total costs applicable at 18,000 kilometres and 27,000 kilometres and the total cost per mile at each of these mileages.
(b) A friend of yours recently read a statement in a cost accounting book which did not appear to make sense. The statement was ‘the more kilometres you travel, the cheaper it becomes.’ Comment briefly on this statement, concluding whether the statement makes sense or not.
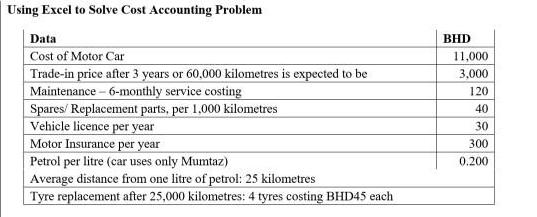
Using Excel to Solve Cost Accounting Problem Data Cost of Motor Car Trade-in price after 3 years or 60,000 kilometres is expected to be Maintenance - 6-monthly service costing Spares/ Replacement parts, per 1,000 kilometres Vehicle licence per year Motor Insurance per year Petrol per litre (car uses only Mumtaz) Average distance from one litre of petrol: 25 kilometres Tyre replacement after 25,000 kilometres: 4 tyres costing BHD45 each BHD 11,000 3,000 120 40 30 300 0.200
Step by Step Solution
There are 3 Steps involved in it
i No of Kms per year Particulars 5000 10000 15000 20000 25000 30000 Variable ... View full answer

Get step-by-step solutions from verified subject matter experts