

Question: Using Excel, what would be the appropriate Scatter Diagram from the Data shown in the chart below and then answer the questions. The table represents
Using Excel, what would be the appropriate Scatter Diagram from the Data shown in the chart below and then answer the questions. The table represents a home realtor's aptitude test score and the number of homes they sold in a year. Hint: The Score on the Aptitude Test is the Independent Variable (X-Axis) and the Number of Home Sales per Year is the Dependent Variable (Y-Axis). 2. In well-written sentences is a relationship between a realtor's aptitude test score and how well they perform as realtors. Why do you say that? discuss your R-Squared value when explaining if a relationship exists. .3. How do you explain data point #9? What could be some possible reasons for it? What is the first action you should take when discovering an Outlier in your dataset? Be detailed and insightful and provide at least 5 different reasons for data point #9.
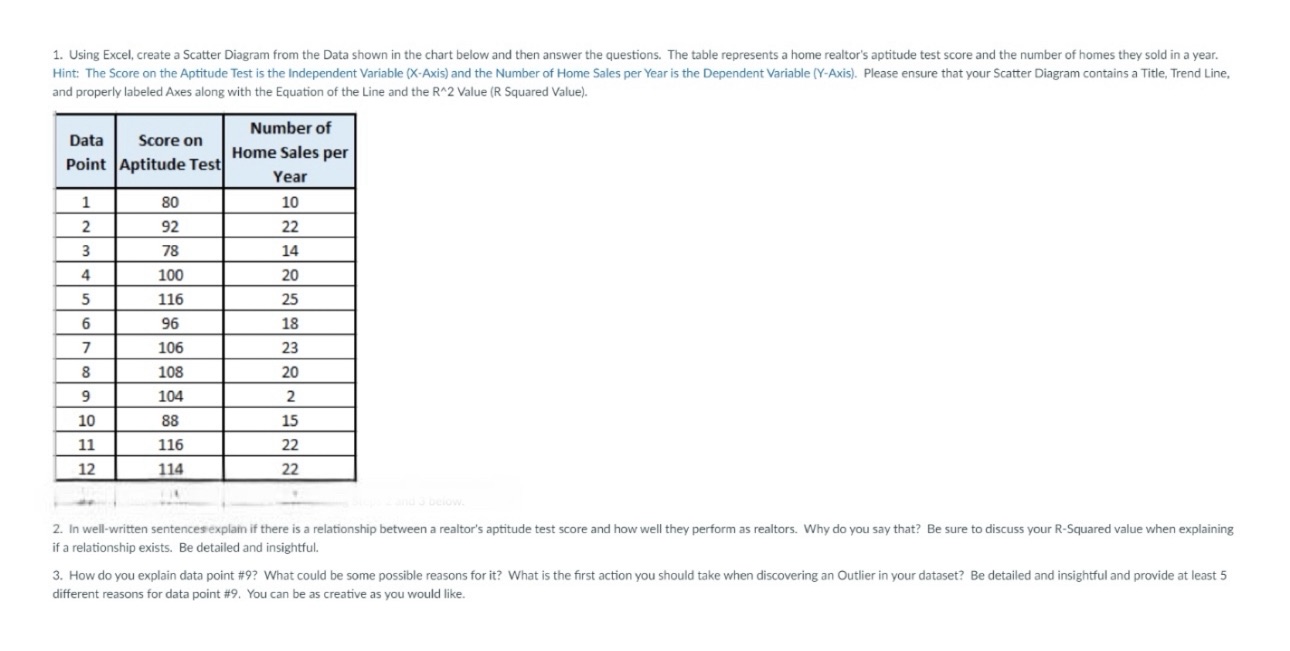
1. Using Excel, create a Scatter Diagram from the Data shown in the chart below and then answer the questions. The table represents a home realtor's aptitude test score and the number of homes they sold in a year. Hint: The Score on the Aptitude Test is the Independent Variable (X-Axis) and the Number of Home Sales per Year is the Dependent Variable (Y-Axis). Please ensure that your Scatter Diagram contains a Title, Trend Line, and properly labeled Axes along with the Equation of the Line and the R*2 Value (R Squared Value). 2. In well-written sentencesexplain if there is a relationship between a realtor's aptitude test score and how well they perform as realtors. Why do you say that? Be sure to discuss your R-Squared value when explaining if a relationship exists. Be detailed and insightful. 3. How do you explain data point #97 What could be some possible reasons for it? What is the first action you should take when discovering an Outlier in your dataset? Be detailed and insightful and provide at least 5 different reasons for data point #9. You can be as creative as you would like
Step by Step Solution
There are 3 Steps involved in it

Get step-by-step solutions from verified subject matter experts