

Question: Using Excel with j being the cost equation that also has theta 1 and theta 0 and h(x) = theta 0 +theta 1((x)) j=.5 (M)
Using Excel with j being the cost equation that also has theta 1 and theta 0 and h(x) = theta 0 +theta 1((x))
j=.5 (M) (sum(h(x)-y)^2) this is the cost equation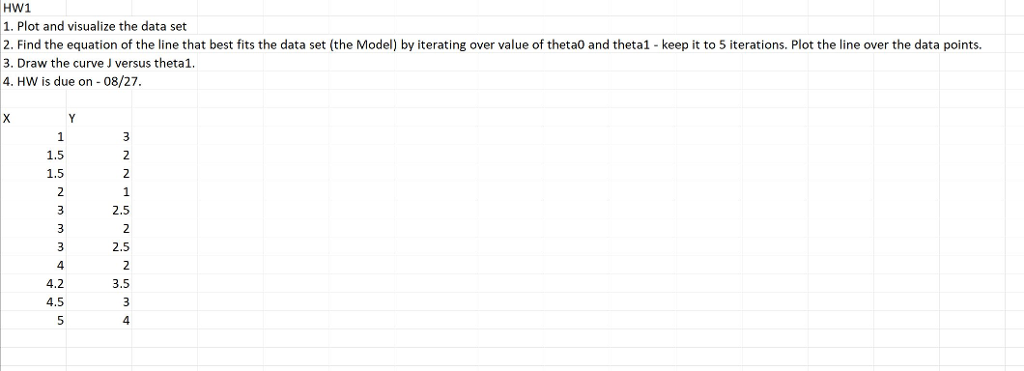
Plot and visualize the data set Find the equation of the line that best fits the data set (the Model) by iterating over value of theta0 and theta1 - keep it to 5 iterations. Plot the line over the data points. Draw the curve J versus theta1. HW is due on -08/27. X Y 1 3 1.5 2 1.5 2 2 1 3 2.5 3 2 3 2.5 3 2 3 2.5 4 2 4.2 3.5 4.5 3 5 4
Step by Step Solution
There are 3 Steps involved in it
1 Expert Approved Answer
Step: 1 Unlock

Question Has Been Solved by an Expert!
Get step-by-step solutions from verified subject matter experts
Step: 2 Unlock
Step: 3 Unlock