

Question: Using excell sheets and Data for group (31) , please solve the followibg project 3. They should study Appendix A' and the following book examples
Using excell sheets and Data for group (31) , please solve the followibg project
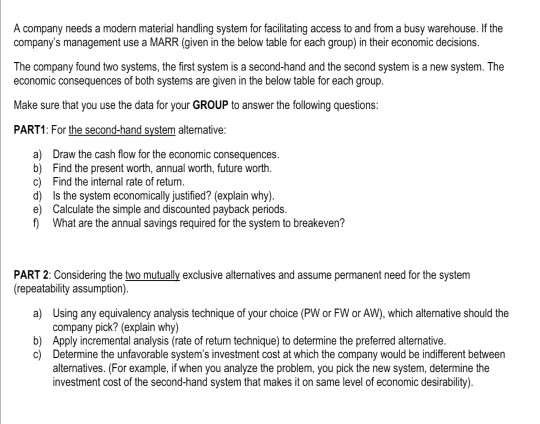
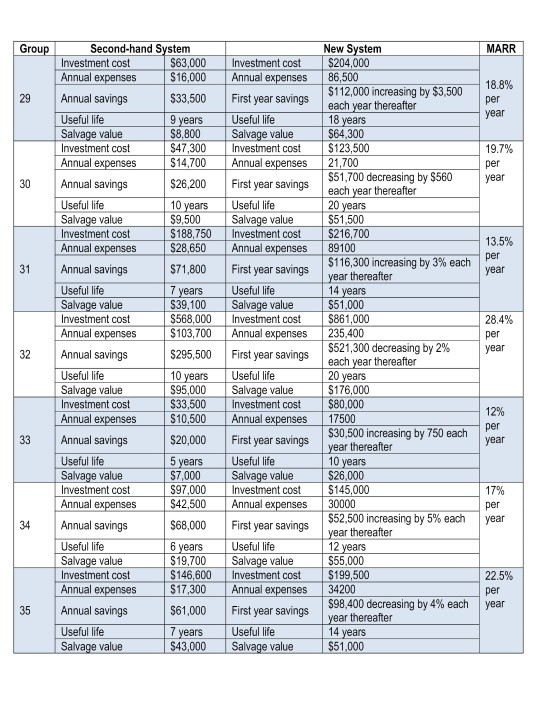
3. They should study "Appendix A' and the following book examples on how to use spreadsheets to solve specific economics problems:example 4-2, 4-16, 4-25,5-12,5-13, 6-2, 6-5, 6-7, and section 5.10. 4. Each group should use its own specific input data (refer to Table on pages 3-8 for each group) 5. Use excel to draw cash flow diagrams, 6. Use excel to analyze the case study 7. Answer each question (use several sheets in the excel file to organize the answers), 8. Use excel financial functions and can type their own equations, such as addition and subtraction equations (if needed). 9. Note that you need to add decisions based on your analysis results, A company needs a modern material handling system for facilitating access to and from a busy warehouse. If the company's management use a MARR (given in the below table for each group) in their economic decisions The company found two systems, the first system is a second-hand and the second system is a new system. The economic consequences of both systems are given in the below table for each group. Make sure that you use the data for your GROUP to answer the following questions PART1: For the second-hand system alternative: a) Draw the cash flow for the economic consequences. b) Find the present worth, annual worth, future worth. c) Find the internal rate of return. d) Is the system economically justified? (explain why). e) Calculate the simple and discounted payback periods. 1 What are the annual savings required for the system to breakeven? PART 2: Considering the two mutually exclusive alternatives and assume permanent need for the system (repeatability assumption). a) Using any equivalency analysis technique of your choice (PW or FW or AW), which alternative should the company pick? (explain why) b) Apply incremental analysis (rate of return technique) to determine the preferred alternative. c) Determine the unfavorable system's investment cost at which the company would be indifferent between alternatives. (For example, if when you analyze the problem, you pick the new system, determine the investment cost of the second-hand system that makes it on same level of economic desirability) Group MARR 18.8% per year Second-hand System Investment cost $63,000 Annual expenses $16,000 Annual savings $33,500 Useful life 9 years 9 vears Salvage value $8,800 Investment cost $47,300 Annual expenses $14,700 Annual savings $26,200 Useful life 10 years Salvage value $9,500 Investment cost S188,750 Annual expenses $28,650 Investment cost Annual expenses First year savings Useful life Useful life Salvage value Investment cost Annual expenses First year savings Useful life Salvage value Investment cost Annual expenses 19.7% per year 30 13.5% per year 31 Annual savings $71,800 7 years $39,100 $568,000 $103,700 First year savings Useful life Salvage value Investment cost Annual expenses 28.4% per year Useful life Salvage value Investment cost Annual expenses Annual savings Useful life Salvage value Investment cost Annual expenses 32 New System $204.000 86,500 $112,000 increasing by $3,500 each year thereafter 18 years $64,300 $123,500 21,700 $51,700 decreasing by $560 each year thereafter 20 years $51,500 S216,700 89100 $116,300 increasing by 3% each year thereafter 14 years $51,000 $861,000 235,400 $521,300 decreasing by 2% each year thereafter 20 years $176.000 $80,000 17500 $30,500 increasing by 750 each year thereafter 10 years $26,000 $145,000 30000 $52,500 increasing by 5% each year thereafter 12 years $55,000 $199,500 34200 $98,400 decreasing by 4% each year thereafter 14 years $51,000 First year savings Useful life Salvage value Investment cost Annual expenses $295,500 10 years $95,000 $33,500 $10,500 $20,000 5 years $7,000 S97,000 $42,500 12% per year 33 Annual savings Useful life Salvage value Investment cost Annual expenses First year savings Useful life Salvage value Investment cost Annual expenses 17% per year 34 Annual savings $68,000 6 years $19,700 $146,600 $17,300 First year savings Useful life Salvage value Investment cost Annual expenses Useful life Salvage value Investment cost Annual expenses Annual savings Useful life Salvage value 22.5% per year 35 $61,000 7 years $43,000 First year savings Useful life Salvage value 3. They should study "Appendix A' and the following book examples on how to use spreadsheets to solve specific economics problems:example 4-2, 4-16, 4-25,5-12,5-13, 6-2, 6-5, 6-7, and section 5.10. 4. Each group should use its own specific input data (refer to Table on pages 3-8 for each group) 5. Use excel to draw cash flow diagrams, 6. Use excel to analyze the case study 7. Answer each question (use several sheets in the excel file to organize the answers), 8. Use excel financial functions and can type their own equations, such as addition and subtraction equations (if needed). 9. Note that you need to add decisions based on your analysis results, A company needs a modern material handling system for facilitating access to and from a busy warehouse. If the company's management use a MARR (given in the below table for each group) in their economic decisions The company found two systems, the first system is a second-hand and the second system is a new system. The economic consequences of both systems are given in the below table for each group. Make sure that you use the data for your GROUP to answer the following questions PART1: For the second-hand system alternative: a) Draw the cash flow for the economic consequences. b) Find the present worth, annual worth, future worth. c) Find the internal rate of return. d) Is the system economically justified? (explain why). e) Calculate the simple and discounted payback periods. 1 What are the annual savings required for the system to breakeven? PART 2: Considering the two mutually exclusive alternatives and assume permanent need for the system (repeatability assumption). a) Using any equivalency analysis technique of your choice (PW or FW or AW), which alternative should the company pick? (explain why) b) Apply incremental analysis (rate of return technique) to determine the preferred alternative. c) Determine the unfavorable system's investment cost at which the company would be indifferent between alternatives. (For example, if when you analyze the problem, you pick the new system, determine the investment cost of the second-hand system that makes it on same level of economic desirability) Group MARR 18.8% per year Second-hand System Investment cost $63,000 Annual expenses $16,000 Annual savings $33,500 Useful life 9 years 9 vears Salvage value $8,800 Investment cost $47,300 Annual expenses $14,700 Annual savings $26,200 Useful life 10 years Salvage value $9,500 Investment cost S188,750 Annual expenses $28,650 Investment cost Annual expenses First year savings Useful life Useful life Salvage value Investment cost Annual expenses First year savings Useful life Salvage value Investment cost Annual expenses 19.7% per year 30 13.5% per year 31 Annual savings $71,800 7 years $39,100 $568,000 $103,700 First year savings Useful life Salvage value Investment cost Annual expenses 28.4% per year Useful life Salvage value Investment cost Annual expenses Annual savings Useful life Salvage value Investment cost Annual expenses 32 New System $204.000 86,500 $112,000 increasing by $3,500 each year thereafter 18 years $64,300 $123,500 21,700 $51,700 decreasing by $560 each year thereafter 20 years $51,500 S216,700 89100 $116,300 increasing by 3% each year thereafter 14 years $51,000 $861,000 235,400 $521,300 decreasing by 2% each year thereafter 20 years $176.000 $80,000 17500 $30,500 increasing by 750 each year thereafter 10 years $26,000 $145,000 30000 $52,500 increasing by 5% each year thereafter 12 years $55,000 $199,500 34200 $98,400 decreasing by 4% each year thereafter 14 years $51,000 First year savings Useful life Salvage value Investment cost Annual expenses $295,500 10 years $95,000 $33,500 $10,500 $20,000 5 years $7,000 S97,000 $42,500 12% per year 33 Annual savings Useful life Salvage value Investment cost Annual expenses First year savings Useful life Salvage value Investment cost Annual expenses 17% per year 34 Annual savings $68,000 6 years $19,700 $146,600 $17,300 First year savings Useful life Salvage value Investment cost Annual expenses Useful life Salvage value Investment cost Annual expenses Annual savings Useful life Salvage value 22.5% per year 35 $61,000 7 years $43,000 First year savings Useful life Salvage value
Step by Step Solution
There are 3 Steps involved in it

Get step-by-step solutions from verified subject matter experts