Question: Using Excel's Functions for Data Analysis Due: Check Blackboard Course Site for Due Date Case Background: You have been hired by John McDougal, sales manager
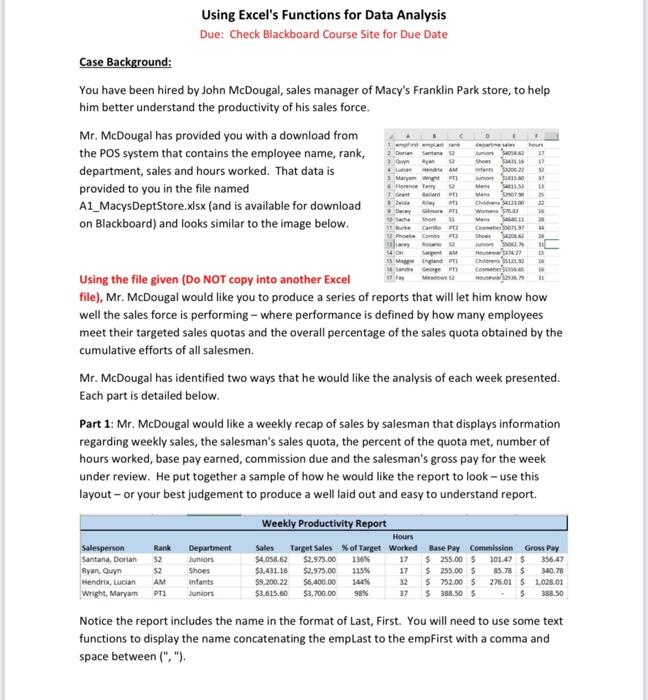
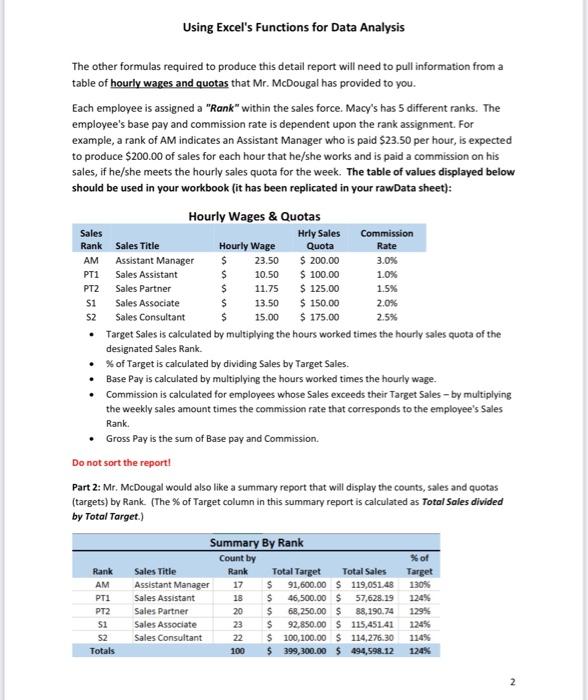
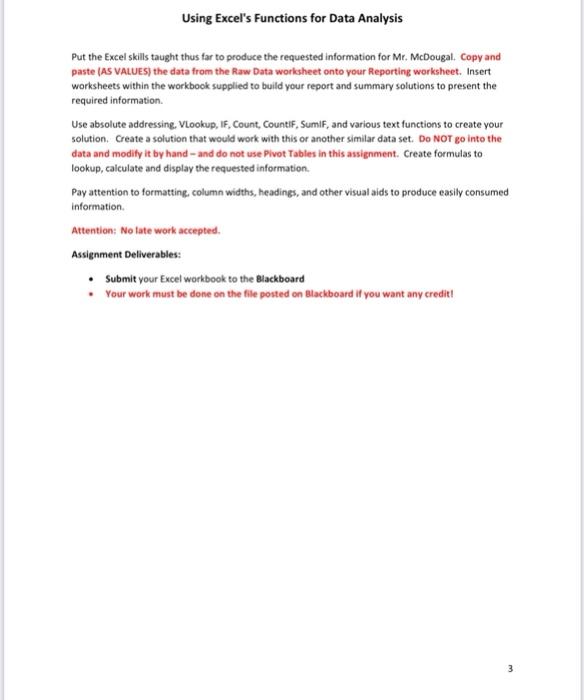
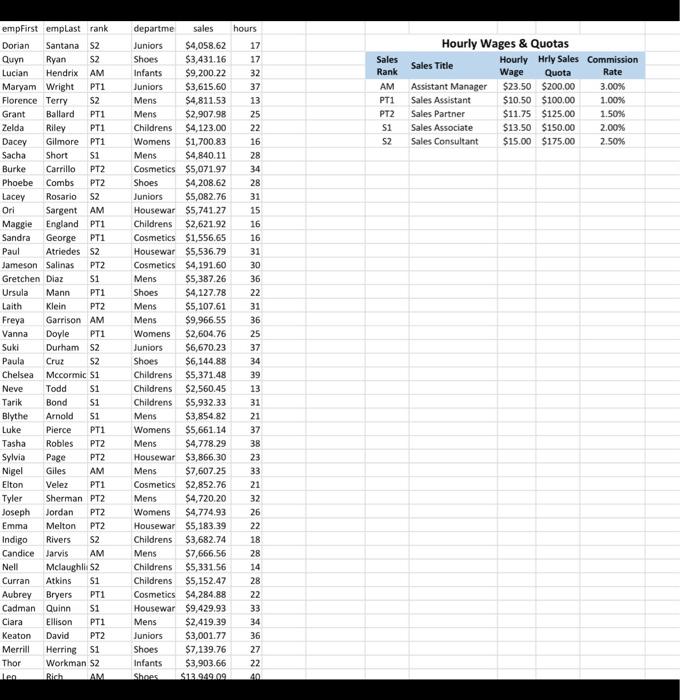
Using Excel's Functions for Data Analysis Due: Check Blackboard Course Site for Due Date Case Background: You have been hired by John McDougal, sales manager of Macy's Franklin Park store, to help him better understand the productivity of his sales force. Mr. McDougal has provided you with a download from the POS system that contains the employee name, rank, department, sales and hours worked. That data is provided to you in the file named departme sales hours J 17 Shoes M411.16 17 3320022 32 37 11 Jun123.40 15 1 empfirst emplastrank 2 Dorian Santana 12 Quyn Ayan 12 La HAM Maryam Wright P Florence Terry 12 Ga Ballard PEZ Riley P11 Gore P short 13 11 Burke Camilo P12 Phoebe Combs Lacey Rosan Man Mens A1_MacysDeptStore.xlsx (and is available for download on Blackboard) and looks similar to the image below. vid Dway 10 Sache Man 25 Childrens 34121.00 22 Womens $703 14 SA11 20 C07197 34 Shoes42042 20 Junion 2.7 n H37427 is Child 5121.97 16 Come $6.5 31 14 On is Maggie Sandra Sargent AM England P George T Meadows 12 Using the file given (Do NOT copy into another Excel file), Mr. McDougal would like you to produce a series of reports that will let him know how well the sales force is performing - where performance is defined by how many employees meet their targeted sales quotas and the overall percentage of the sales quota obtained by the cumulative efforts of all salesmen. Mr. McDougal has identified two ways that he would like the analysis of each week presented. Each part is detailed below. Part 1: Mr. McDougal would like a weekly recap of sales by salesman that displays information regarding weekly sales, the salesman's sales quota, the percent of the quota met, number of hours worked, base pay earned, commission due and the salesman's gross pay for the week under review. He put together a sample of how he would like the report to look - use this layout - or your best judgement to produce a well laid out and easy to understand report. Weekly Productivity Report Hours Gross Pay Rank $2 Department Juniors 356.47 Salesperson Santana, Dorian Ryan, Quyn Hendrix, Lucian AM Infants Wright, Maryam PT1 Juniors $2 Shoes Sales Target Sales % of Target Worked $4,058.62 $2,975.00 136% 17 $3,431.16 $2.975,00 115% 17 $9,200.22 $6,400.00 144% 32 $3,615.60 $3,700.00 98% 37 Base Pay Commission $255.00 $ 101.47 $ $ 255.00 $ 85.78 $ 340.78 276.01 $ 1.028.01 $ 388.50 5 752.00 $ $ 388.50 $ Notice the report includes the name in the format of Last, First. You will need to use some text functions to display the name concatenating the emplast to the empFirst with a comma and space between (","). Using Excel's Functions for Data Analysis The other formulas required to produce this detail report will need to pull information from a table of hourly wages and quotas that Mr. McDougal has provided to you. Each employee is assigned a "Rank" within the sales force. Macy's has 5 different ranks. The employee's base pay and commission rate is dependent upon the rank assignment. For example, a rank of AM indicates an Assistant Manager who is paid $23.50 per hour, is expected to produce $200.00 of sales for each hour that he/she works and is paid a commission on his sales, if he/she meets the hourly sales quota for the week. The table of values displayed below should be used in your workbook (it has been replicated in your rawData sheet): Hourly Wages & Quotas Sales Hrly Sales Commission Rank Sales Title Hourly Wage Quota Rate AM Assistant Manager 23.50 $ 200.00 3.0% PT1 Sales Assistant $ 10.50 $ 100.00 1.0% PT2 Sales Partner $ 11.75 $ 125.00 1.5% $1 Sales Associate 13.50 $ 150.00 2.0% $2 Sales Consultant $ 15.00 $ 175.00 2.5% Target Sales is calculated by multiplying the hours worked times the hourly sales quota of the designated Sales Rank. % of Target is calculated by dividing Sales by Target Sales. Base Pay is calculated by multiplying the hours worked times the hourly wage. Commission is calculated for employees whose Sales exceeds their Target Sales - by multiplying the weekly sales amount times the commission rate that corresponds to the employee's Sales Rank. Gross Pay is the sum of Base pay and Commission. Do not sort the report! Part 2: Mr. McDougal would also like a summary report that will display the counts, sales and quotas (targets) by Rank. (The % of Target column in this summary report is calculated as Total Sales divided by Total Target.) Summary By Rank Count by % of Rank Sales Title Target Rank 17 $ Total Sales 91,600.00 $ 119,051.48 AM Assistant Manager 130% PT1 Sales Assistant $ 124% PT2 Sales Partner 20 $ 129% 51 Sales Associate 46,500.00 $ 57,628.19 68,250.00 $ 88,190.74 $ 92,850.00 $ 115,451.41 100,100.00 $ 114,276.30 114% 399,300.00 $ 494,598.12 124% 124% Sales Consultant 52 Totals 498328 18 Total Target 22 $ 100 $ Using Excel's Functions for Data Analysis Put the Excel skills taught thus far to produce the requested information for Mr. McDougal. Copy and paste (AS VALUES) the data from the Raw Data worksheet onto your Reporting worksheet. Insert worksheets within the workbook supplied to build your report and summary solutions to present the required information. Use absolute addressing, VLookup, IF, Count, CountIF, SumIF, and various text functions to create your solution. Create a solution that would work with this or another similar data set. Do NOT go into the data and modify it by hand-and do not use Pivot Tables in this assignment. Create formulas to lookup, calculate and display the requested information. Pay attention to formatting, column widths, headings, and other visual aids to produce easily consumed information. Attention: No late work accepted. Assignment Deliverables: Submit your Excel workbook to the Blackboard Your work must be done on the file posted on Blackboard if you want any credit! empFirst emplast rank Dorian Santana $2 Quyn Ryan $2 Lucian Hendrix AM Maryam Wright PT1 S2 Florence Terry Grant Ballard PT1 Zelda Riley PT1 Dacey Gilmore PT1 $1 Sacha Short Burke Carrillo PT2 Phoebe Combs PT2 Rosario S2 Lacey Ori Sargent AM England PT1 Maggie Sandra George PT1 Atriedes S2 Paul Jameson Salinas PT2 Gretchen Diaz $1 Ursula Mann PT1 Laith Klein PT2 Freya Garrison AM Vanna Doyle PT1 Suki Durham S2 Paula Cruz $2 Chelsea Mccormic S1 Neve Todd S1 Tarik Bond $1 Blythe Arnold S1 Luke Pierce PT1 Tasha Robles PT2 Sylvia Page PT2 Nigel Giles AM Elton Velez PT1 Tyler Sherman PT2 Joseph Jordan PT2 Emma Melton PT2 Indigo Rivers S2 Candice Jarvis AM Nell Mclaughli $2 Curran Atkins $1 Aubrey Bryers PT1 Cadman Quinn $1 Ciara Ellison PT1 Keaton David PT2 Merrill Herring $1 Workman S2 Thor Len Rich AM departme sales hours. 17 Juniors $4,058.62 Shoes $3,431.16 17 Infants $9,200.22 32 Juniors $3,615.60 37 Mens $4,811.53 13 $2,907.98 25 Mens Childrens $4,123.00 22 Womens $1,700.83 16 Mens $4,840.11 28 Cosmetics $5,071.97 34 Shoes $4,208.62 28 Juniors $5,082.76 31 Housewar $5,741.27 15 Childrens $2,621.92 16 Cosmetics $1,556.65 16 Housewar $5,536.79 31 Cosmetics $4,191.60 30 Mens $5,387.26 36 Shoes $4,127.78 22 Mens $5,107.61 31 Mens $9,966.55 36 Womens $2,604.76 25 Juniors $6,670.23 37 Shoes $6,144.88 34 Childrens $5,371.48 39 Childrens $2,560.45 13 Childrens $5,932.33 31 Mens $3,854.82 21 37 $5,661.14 Womens Mens $4,778.29 38 Housewar $3,866.30 23 Mens $7,607.25 33 Cosmetics $2,852.76 21 Mens $4,720.20 32 Womens $4,774.93 26 Housewar $5,183.39 22 Childrens $3,682.74 18 Mens $7,666.56 28 Childrens $5,331.56 14 Childrens $5,152.47 28 Cosmetics $4,284.88 22 Housewar $9,429.93 33 Mens $2,419.39 34 Juniors $3,001.77 36 Shoes $7,139.76 27 Infants $3,903.66 22 $13.949.09 Shoes 40 Sales Rank AM PT1 PT2 $1 S2 Hourly Wages & Quotas Sales Title Assistant Manager Sales Assistant Sales Partner Sales Associate Sales Consultant Hourly Hrly Sales Commission Wage Quota Rate $23.50 $200.00 3.00% $10.50 $100.00 1.00% $11.75 $125.00 1.50% 2.00% $13.50 $150.00 $15.00 $175.00 2.50%