

Question: using exel or spss CDI mean E* / The following table presents measurements of viscosity of ethanol: 5 Marks I 1 2 3 4 5
using exel or spss 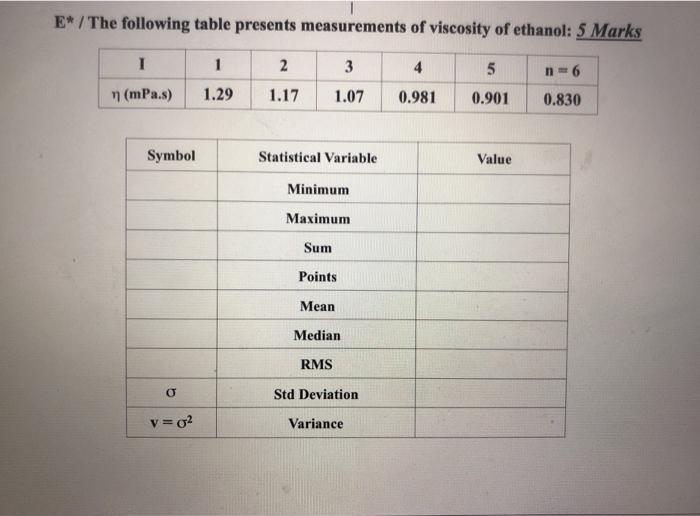
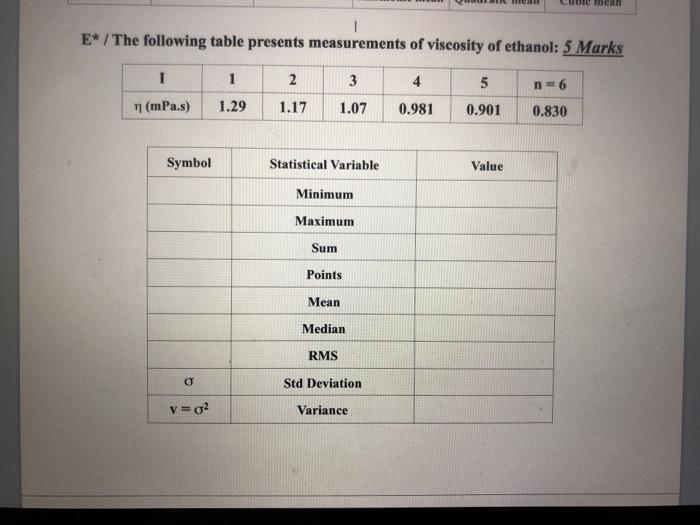
CDI mean E* / The following table presents measurements of viscosity of ethanol: 5 Marks I 1 2 3 4 5 n=6 n (mPa.s) 1.29 1.17 1.07 0.981 0.901 0.830 Symbol Statistical Variable Value Minimum Maximum Sum Points Mean Median RMS o Std Deviation v=02 Variance E* / The following table presents measurements of viscosity of ethanol: 5 Marks I 1 2 3 4 5 n=6 n (mPa.s) 1.29 1.17 1.07 0.981 0.901 0.830 Symbol Statistical Variable Value Minimum Maximum Sum Points Mean Median RMS o Std Deviation v=g2 Variance
Step by Step Solution
There are 3 Steps involved in it
1 Expert Approved Answer
Step: 1 Unlock

Question Has Been Solved by an Expert!
Get step-by-step solutions from verified subject matter experts
Step: 2 Unlock
Step: 3 Unlock