

Question: Using Exhibit, prepare common size ratios for Smith City for its governmental activities. Using Exhibit calculate current ratios for Smith City for governmental activities, business-type
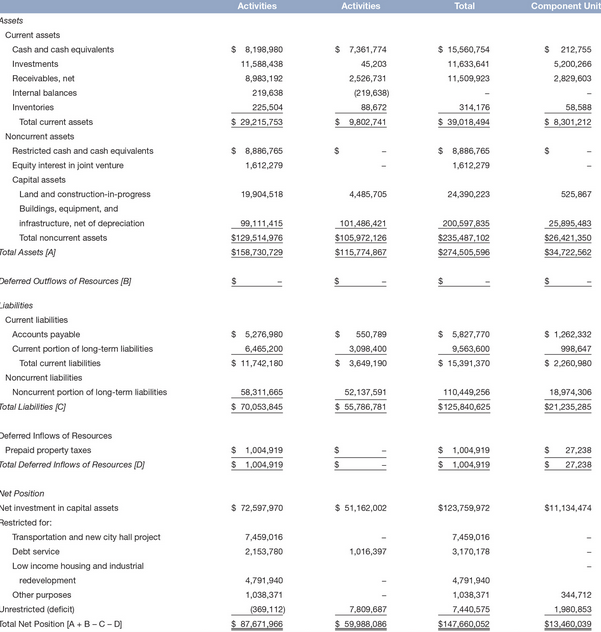
Using Exhibit, prepare common size ratios for Smith City for its governmental activities. Using Exhibit calculate current ratios for Smith City for governmental activities, business-type activities, total, and component units. Using Exhibit calculate the solvency ratio of long-term debt to total net position for the governmental activities.
Activities Activities Total Component Unit $ 7,361,774 45,203 2.526,731 $ 15,560,754 11,633,641 11,509,923 $ 212.755 5,200,266 2,829,603 $ 8,198,980 11,588,438 8.983.192 219,638 225,504 $ 29,215,753 (219,638) 88.672 $ 9,802,741 58,588 314,176 $ 39,018,494 $ 8,301,212 Assets Current assets Cash and cash equivalents Investments Receivables, net Internal balances Inventories Total current assets Noncurrent assets Restricted cash and cash equivalents Equity interest in joint venture Capital assets Land and construction in progress Buildings, equipment, and infrastructure, net of depreciation Total noncurrent assets Total Assets [A $ $ $ 8,886,765 1,612,279 $ 8,886,765 1,612,279 19,904,518 4,485,705 24,390,223 525,867 99,111,415 $129,514,976 $158,730,729 101,486,421 $105.972,126 $115,774,867 200,597,835 $235 487,102 $274,505,596 25,895,483 $26.421,350 $34,722,562 Deferred Outflows of Resources (8) $ $ Liabildies Current liabilities Accounts payable Current portion of long-term liabilities Total current liabilities Noncurrent liabilities Noncurrent portion of long-term liabilities Total Liabilities (C) $ 5,276,980 6,465,200 $ 11,742,180 $ 550,789 3,098,400 $ 3,649,190 $ 5,827,770 9,563,600 $ 15,391,370 $ 1.262,332 998,647 $ 2.260,980 58,311,665 $ 70,053,845 52,137,591 $ 55,786,781 110,449,256 $125,840,625 18,974,306 $21.235,285 Deferred Inflows of Resources Prepaid property taxes Total Deferred Inflows of Resources (D) S $ 1,004,919 $ 1.004,919 $ $ $ 1,004,919 $ 1,004,919 27.238 27.238 $ $ 72,597,970 $ 51,162,002 $123,759,972 $11,134,474 7,459,016 2,153,780 7,459,016 3,170,178 Vet Position Net investment in capital assets Restricted for: Transportation and new city hall project Debt service Low Income housing and industrial redevelopment Other purposes Jnrestricted (deficit) Total Net Position (A+B-C-D 1,016,397 4.791.940 1,038,371 (369,112) $ 87.671.966 4,791,940 1,038,371 7.440,575 $147,660,052 344,712 1.980,853 7,809,687 $ 59.988,086 $13.460.039
Step by Step Solution
There are 3 Steps involved in it

Get step-by-step solutions from verified subject matter experts